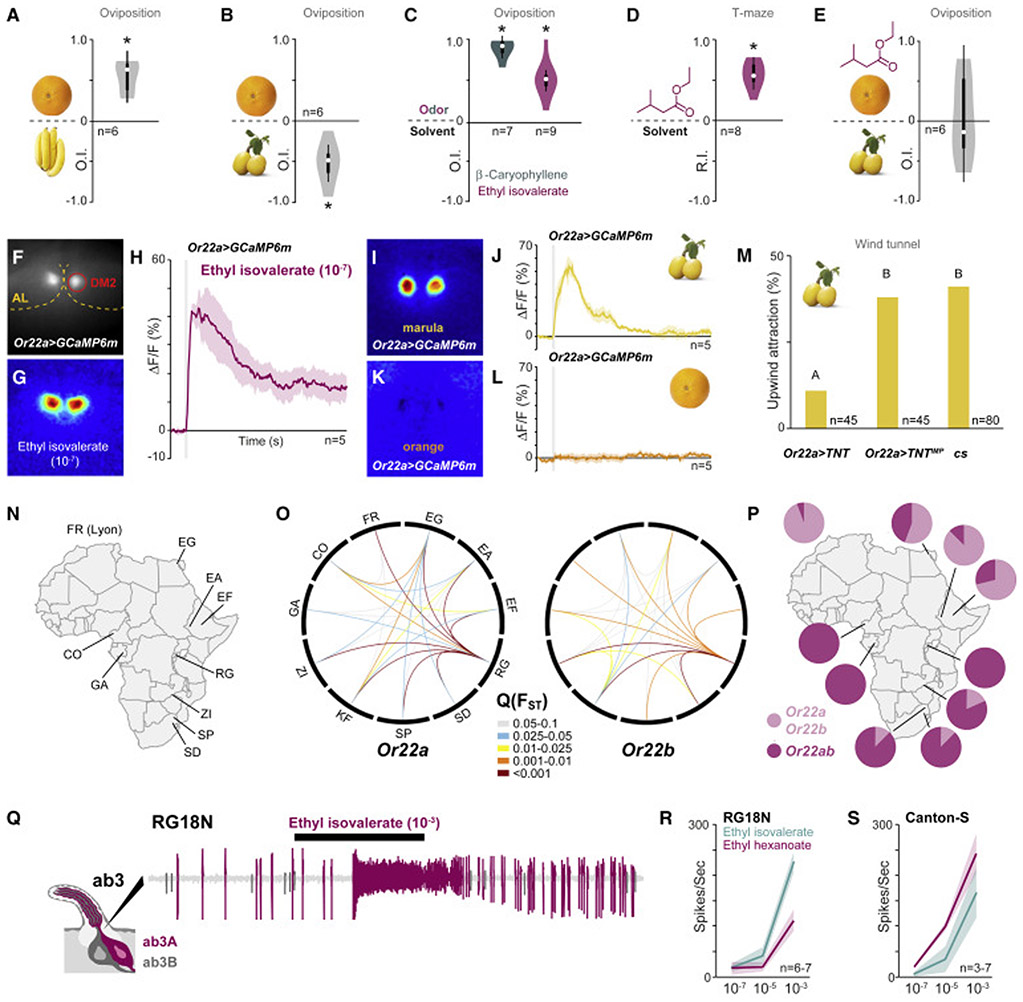
Figure 3. Wild D. melanogaster from mopane woodlands are closely associated with marula.
(A) Violin plots showing oviposition indices (OI) of Canton-S flies from a binary-choice test between standard cornmeal fly food mixed with orange or banana pulp. Violin plots as per Figure 2G. Deviation of the OI against zero was analyzed for significance (*) with a one-sample Wilcoxon test (p < 0.05).
(B) Violin plots showing OI of Canton-S flies from a binary-choice test between standard cornmeal fly food mixed with orange or marula pulp, or (C) fly food mixed with ß-caryophyllene or ethyl isovalerate against fly food alone. Violin plots as per Figure 2G. Deviation of the OI against zero was analyzed for significance (*) with a one-sample Wilcoxon test (p < 0.05).
(D) Violin plots showing the Response Index (RI) of canton-S flies towards ethyl isovalerate (10−4) in a mini T-maze (depicted left). Violin plots as per Figure 2G. Deviation of the RI against zero was analyzed for significance (*) with a one-sample Wilcoxon test (p < 0.05).
(E) Violin plots showing OI of canton-S flies from a binary-choice test between standard cornmeal fly food mixed with orange and ethyl isovalerate against fly food with marula. Violin plots as per Figure 2G. Deviation of the OI against zero was analyzed for significance (*) with a one-sample Wilcoxon test (p < 0.05).
(F) Prestimulation view of Or22a-Gal4>UAS-GCaMP6m showing intrinsic fluorescence from the DM2 glomerulus.
(G) Pseudocolored image showing ethyl isovalerate-induced fluorescence changes in the antennal lobe (AL) of a Or22a-Gal4>UAS-GCaMP6m fly.
(H) Averaged traces from DM2 glomerulus of Or22a-Gal4>UAS-GCaMP6m flies stimulated with ethyl isovalerate. Shaded areas represent SEM. Gray bar represents stimulus duration (1 s).
(I) Pseudocolored image showing marula- and orange- (J) induced fluorescence changes in the AL of Or22a- Gal4>UAS-GCaMP6m flies.
(K) Averaged traces from DM2 glomerulus of Or22a-Gal4>UAS-GCaMP6m flies stimulated with marula and orange (L). Shaded areas represent SEM. Gray bar represents stimulus duration (0.5 s).
(M) Marula odor-mediated upwind flight attraction of Or22a-Gal4>UAS-TNT flies in comparison to Or22a-Gal4>UAS-TNTMP and Canton-S (cs). Bars labeled with different letters indicate significant difference as analyzed by a binomial generalized linear model (GLM) followed by Tukey’s test (p < 0.05).
(N) Geographic origin of examined D. melanogaster populations. Abbreviations as per [5].
(O) Genetic differentiation among populations at Or22a and Or22b is depicted via Circos plots [39] based on FST quantiles (Q(FST)). Only connections between populations with unusually high FST values (elevated genetic differentiation) are shown. The red color, for example, indicates that between this pair of populations, less than 0.1% of windows on the same chromosome arm have an FST value this high.
(P) Frequency of the Or22ab allele across the examined D. melanogaster populations.
(Q) Representative single sensillum recording trace from an ab3 sensillum. The larger-amplitude spiking neuron, i.e. ab3A, responds to ethyl isovalerate. The duration of stimulus delivery (0.5 s) is marked by the black bar.
(R) Dose-response curve of ab3A neurons from the RG18N strain and Canton-S (S) toward ethyl isovalerate and ethyl hexanoate. Shaded area shows standard deviation.

