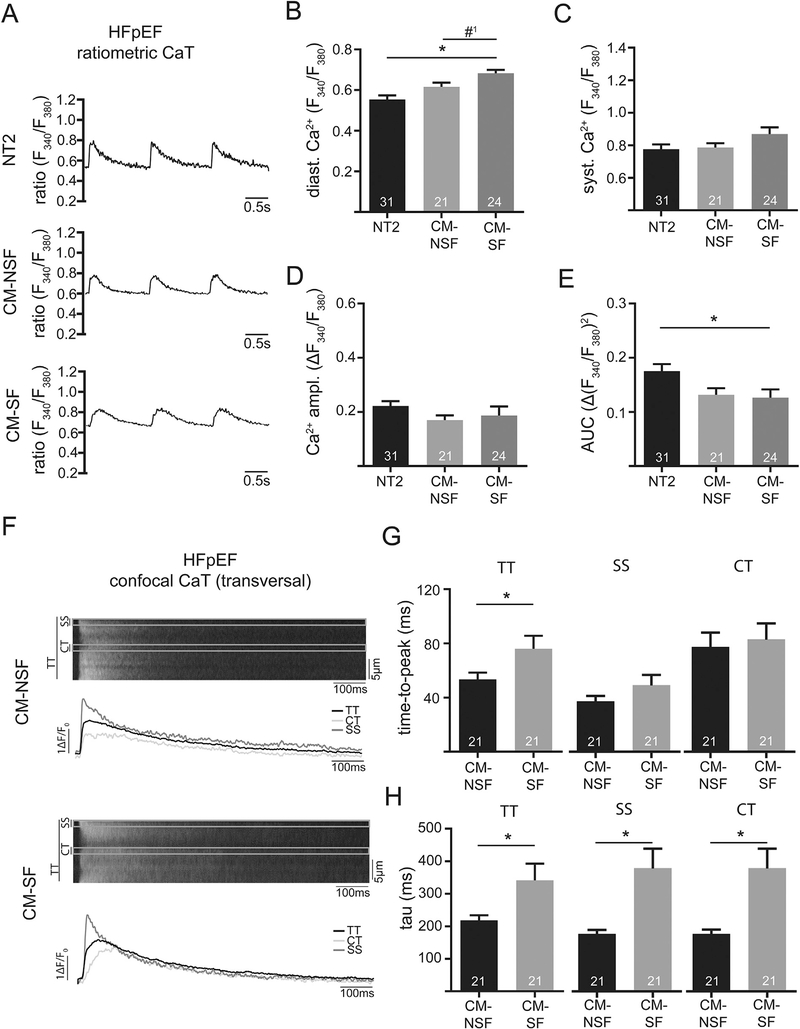
Fig. 5.
Example of ratiometrically recorded CaT (Fura-2) after 1 h incubation with either Normal Tyrode (NT2; 2 mM Ca), conditioned-medium from non-stretched CF (CM-NSF; 0% stretch for 72 h; 1.8 mM Ca) and conditioned medium from stretched CF (CM-SF; 10% stretch for 72 h; 1.8 mM Ca) at 1 Hz steady state stimulation in HFpEF at 21 weeks. Quantification of diastolic (B) and systolic Ca (C), as well as Ca amplitude (D) and area under the curve (E). Example of confocal CaT (Fluo-4) after 1 h incubation with CM-NSF and CM-SF at 1 Hz steady state stimulation. Markings indicate the sub-sarcolemmal region (SS; ROI: 1 μm below cell surface), central region (CT; ROI: 1 μm in cell center) and the total transverse line scan (TT). Quantification of cellular (TT) and sub-cellular (CT, SS) CaT time-to-peak (G) and tau of decay (H). *p < .05; #1p =0.07.

