Fig. 7.
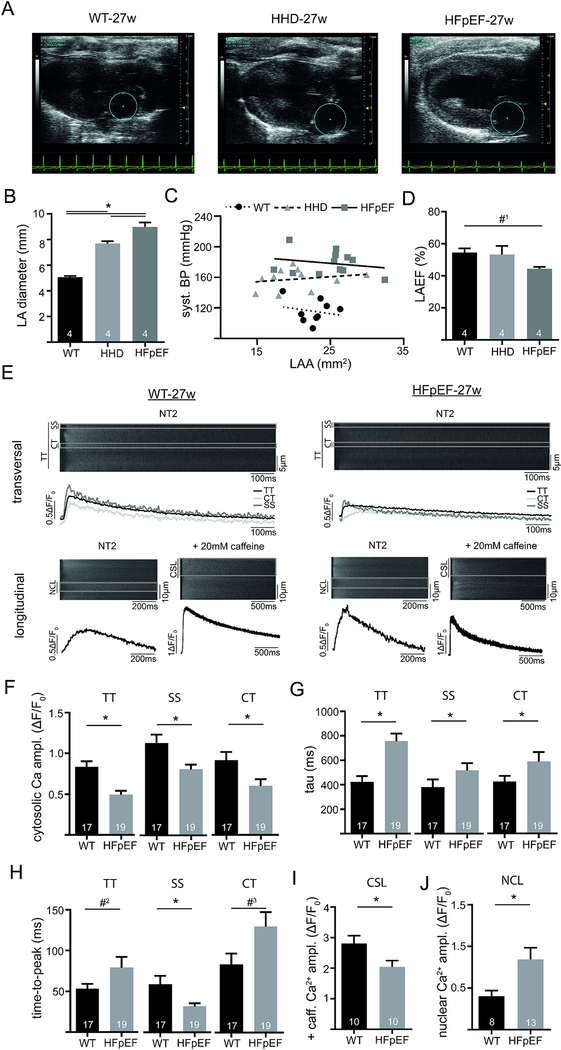
In vivo atrial function in a model of advanced atrial remodeling. Example of parasternal longitudinal axis images obtained with echocardiography in WT, HHD and HFpEF at 27 weeks (A). Marked area depicts the left atrium. LA diameter during diastole (B) and LA ejection fraction (D). Correlation of systolic blood pressure (invasive catheterization) with LA area (C). Example of confocally recorded transversal and longitudinal CaT (E; Fluo4) at baseline conditions in 27-week-old WT and HFpEF at 1 Hz steady state stimulation (transversal and longitudinal) and application of caffeine (longitudinal; 20 mM; without electric stimulation). Markings in the transversal line scans indicate the sub-sarcolemmal region (SS; ROI: 1 μm below cell surface), central region (CT; ROI: 1 μm in cell center) and the total line scan (TT), while markings in the longitudinal line scans indicate the cytosolic region between the sarcolemma and nucleus (CSL) and the nucleus (NCL). Cytosolic (TT) and subcellular (SS, CT) Ca amplitude (F), tau of decay (G) and time-to-peak (H) at 1 Hz steady state stimulation in NT2. Caffeine-triggered (20 mM) cytosolic Ca release without electrical stimulation (I). Nuclear Ca amplitude at 1 Hz steady state stimulation (J). *p < .05; #1p= 0.21; #2 =0.09; #3p = 0.051.

