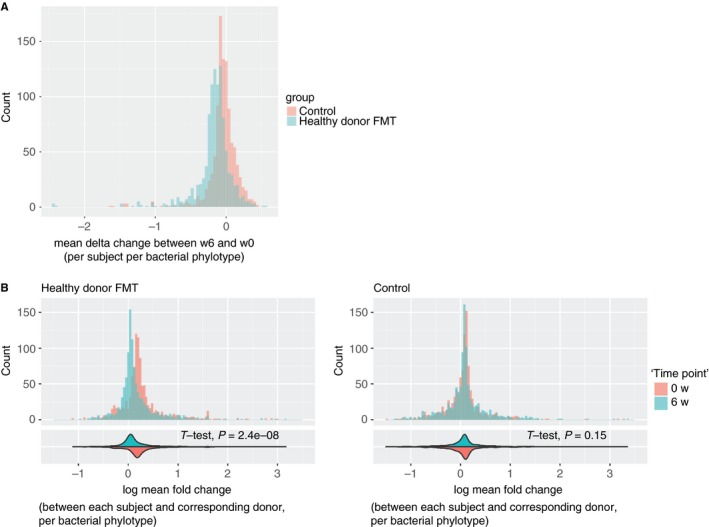
Figure 1.

The change in the microbiome of healthy donor fecal microbiota transplant (FMT) and control subjects. A, The change in the microbiome within the treatment groups after 6 weeks in relation to baseline. B, The change over time in the difference of the microbiome between the subjects and their corresponding donors. The histograms in (B) are accompanied in the bottom with violin plots of the distributions and the student's t‐test P‐value for the difference between the two distributions. For all histograms, all subjects in the respective groups are aggregated by taking the mean of delta change per phylotype
