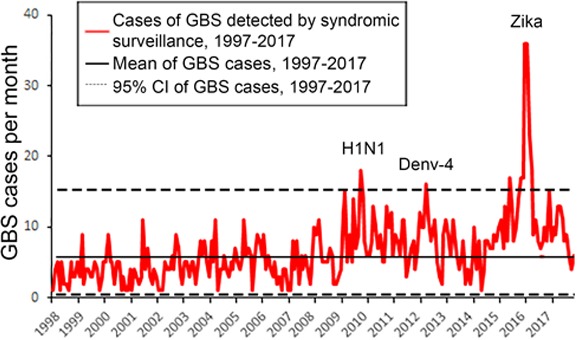
Figure 3.

Time series of cases of GBS detected by syndromic surveillance from 1997–2017 according to the SIH database. We used the Farrington test to identify months in which the number of GBS cases increased significantly over the previous year(s). [Colour figure can be viewed at http://www.wileyonlinelibrary.com]
