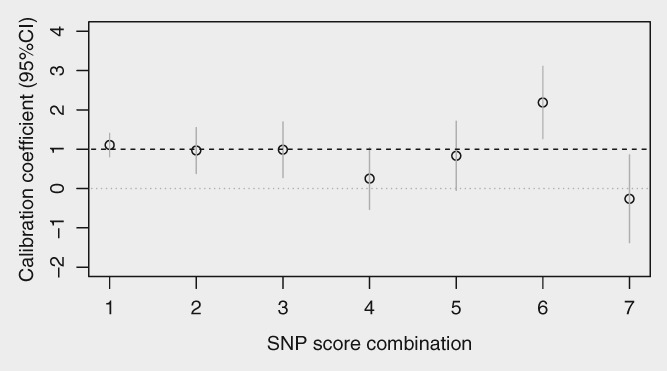
Figure 2.

Calibration (95% CI) of the primary polygenic risk score (unadjusted) split into subscores of 20 SNPs ordered by the overview p‐value for each SNP (1 = top 20 [SNP1–20] predictive SNPs, 2 = next 20 [SNP21–40], similarly 3–6 and 7 = least predictive SNPs [SNP121–143]).
