
Figure 1.
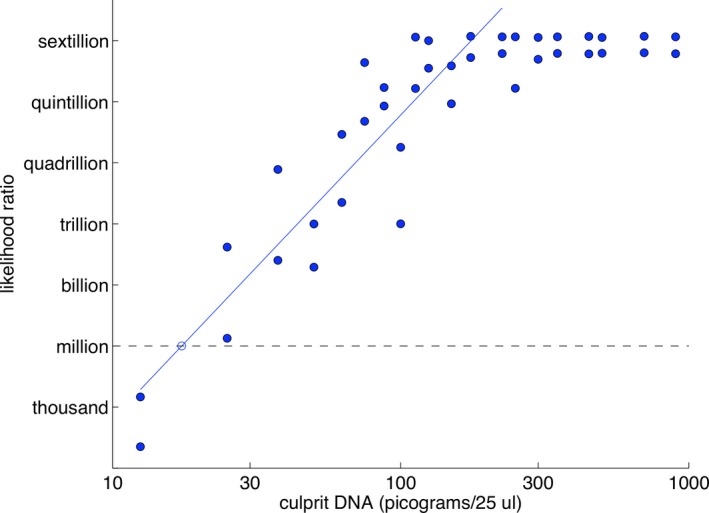
Linearity. Scatterplot showing log(LR) match information (y‐axis) versus log(DNA) (x‐axis) for TrueAllele analysis of forty two‐person mixtures solved assuming a known contributor genotype. The data (blue dots) follow an increasing regression line ramp (solid blue line) that plateaus once reaching maximum match information. The million LR match level is shown (dashed gray line). Reproduced from 20 with permission of the author (https://doi.org/10.1371/journal.pone.0008327.g007)