
Figure 8.
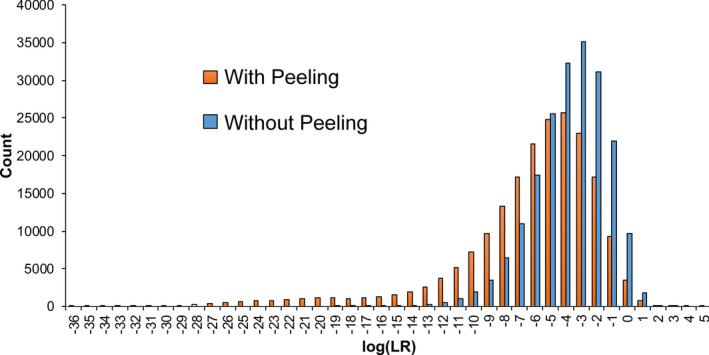
Peeling specificity. The histograms show log(LR) frequency distributions for genotype comparisons to noncontributors. The genotypes were inferred, both with (orange) and without (blue) peeling, from ten‐contributor sample 10‐2.
Official websites use .gov
A
.gov website belongs to an official
government organization in the United States.
Secure .gov websites use HTTPS
A lock (
) or https:// means you've safely
connected to the .gov website. Share sensitive
information only on official, secure websites.
Peeling specificity. The histograms show log(LR) frequency distributions for genotype comparisons to noncontributors. The genotypes were inferred, both with (orange) and without (blue) peeling, from ten‐contributor sample 10‐2.