Figure 1.

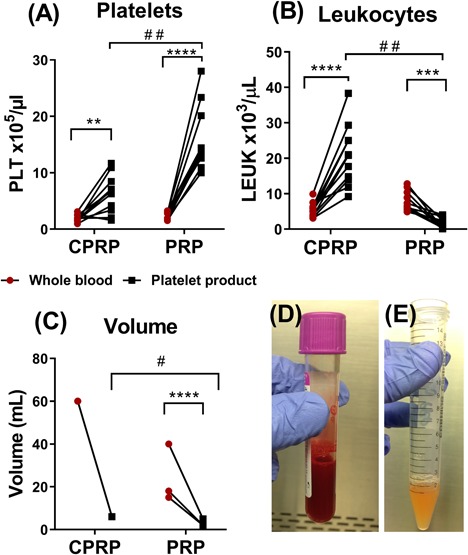
Characterising platelet rich plasma products. Using a haematology analyser, the change in platelets (A), leukocytes (B), and final volume (C) from whole blood to CPRP (n = 11) and PRP (n = 11) were quantified. The increase or decrease of each cell type indicates the change from whole blood (red) to the paired platelet product (black). A paired t‐test was used to compare change in cell type before and after processing (**p < 0.01, ***p < 0.001, and ****p < 0.0001) while a Mann‐Whitney test was used to compare CPRP and PRP (# = p < 0.001, # # = p < 0.0001). Statistics could not be conducted on CPRP's volume analysis (C) due to matching differences between each sample. The photographs show the CPRP fraction product (D) and the PRP product (E).
