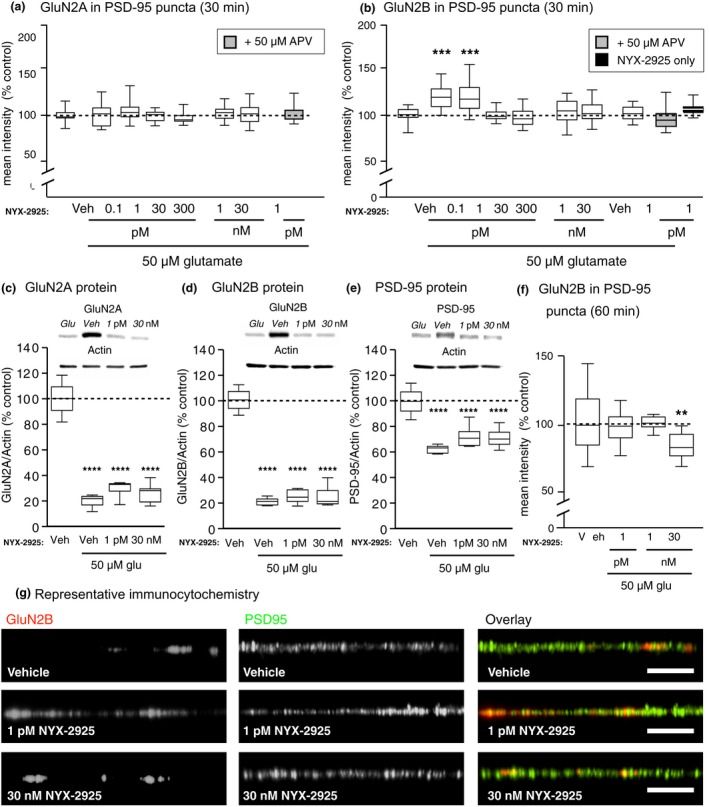
Figure 2.

Quantification of colocalization of N‐methyl‐d‐aspartate receptor subunit 2 (GluN2) with post‐synaptic density protein 95 (PSD‐95). (a) Colocalization of GluN2A with PSD‐95 was unaffected by ((2S, 3R)‐3‐hydroxy‐2‐((R)‐5‐isobutyryl‐1‐oxo‐2,5‐diazaspiro[3,4]octan‐2‐yl) butanamide (NYX‐2925) treatment in the presence 50 μM glutamate. n = 14 cells from two independent cell culture preparations (eight coverslips). (b) After incubating primary hippocampal neurons with various NYX‐2925 concentrations in the presence of 50 μM glutamate, a significant increase in colocalization of GluN2B with PSD‐95 was seen for 0.1 and 1 picomolar concentrations only. This NYX‐2925‐mediated increase in colocalization was blocked by the NMDAR glutamate site antagonist D‐(‐)‐2‐amino‐5‐phosphonovaleric acid (APV) (grey). The antagonist APV was applied via both a 30 min pre‐treatment as well as during the 30 min co‐incubation with NYX‐2925 and glutamate. No change in colocalization was observed if neurons were treated for 30 min with either 1 picomolar NYX‐2925 alone or 50 μM glutamate alone. n = 14 cells from two independent cell culture preparations (eight coverslips). Whole‐cell immunocontent of (c) GluN2A, (d) GluN2B, and (e) PSD‐95 were decreased after 30 min incubation of NYX‐2925 in the presence of 50 μM glutamate, but no difference was seen between either NYX‐2925 concentration in the presence of 50 μM glutamate compared to glutamate alone. n = 5–9 independent cell culture preparations (whole‐cell lysates). (f) No change in colocalization of GluN2B with PSD‐95 was observed after incubating neurons with picomolar NYX‐2925 concentrations in the presence of 50 μM glutamate for 60 min, but colocalization was decreased by continuous exposure to 30 nM NYX‐2925 with 50 μM glutamate. n = 14 cells from two independent cell culture preparations (eight coverslips). (g) Representative dendrites immunolabeled for GluN2B and PSD‐95. Scale bar = 10 μm. Veh: vehicle; Glu: glutamate. Data represent mean ± SEM ± data spread; the line within each box represents the average, the box itself represents the SEM, and the whiskers indicate the spread of the data. **p < 0.01, ***p < 0.001 Tukey post‐hoc analysis, n = 14 cells per treatment; ****p < 0.0001 Dunnett’s post hoc analysis.
