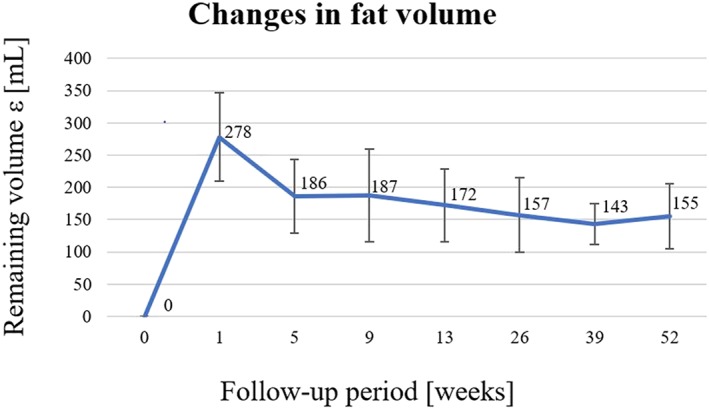
Figure 10.

Average trend and standard deviation of the remaining fat volume for the right breast in a follow‐up period of 12 months. This parameter takes into account the volume of the removed prosthesis and the variations in breast volume (Yoshimura et al., 2006)
