
Figure 5.
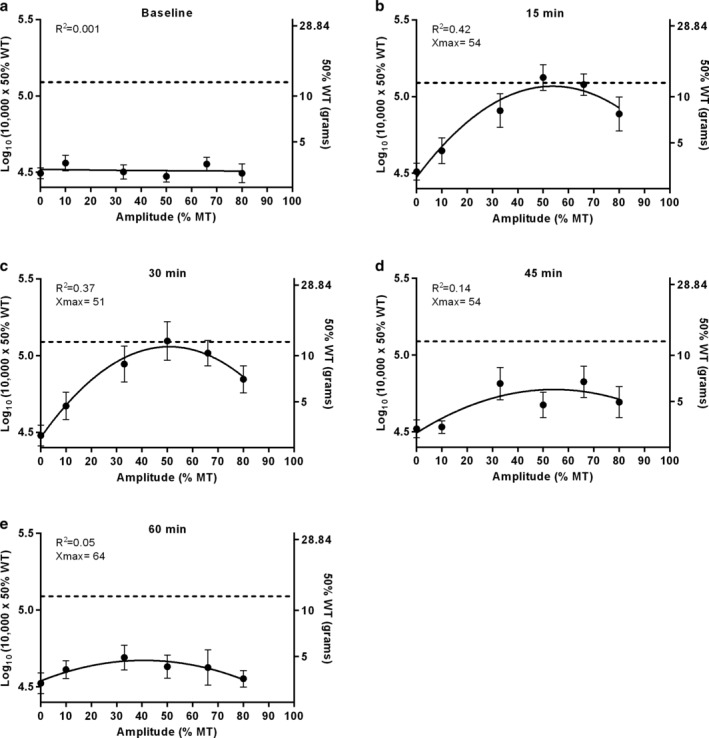
Plots resulting from nonlinear curve‐fitting for the amplitude‐mechanical hypersensitivity interaction for each time point. a. At baseline, no substantial relationship was present between amplitude and mechanical hypersensitivity. b,c. When the stimulator was turned on at 15 and 30 min, the curves describing the amplitude‐mechanical hypersensitivity relationship were downward opening parabolas that can be described by the formula y = c + bx − ax2. Optimal DRGS amplitudes were estimated at 51%–54% MT. d,e. When the stimulator was turned off at 45 and 60 min, the nonlinear relationship became less obvious. Here, the optimal DRGS amplitude was estimated at 54%–64% MT.