Figure 5.

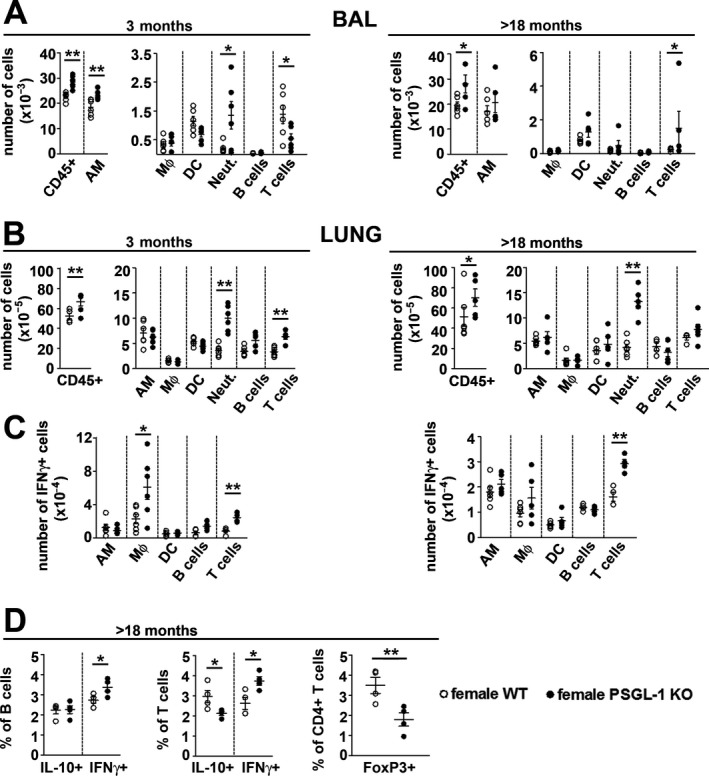
Immune system analysis of the lungs of female wild‐type (WT) and PSGL‐1−/− mice. A, Absolute numbers of immune cell populations isolated from the bronchoalveolar lavage (BAL) fluid of female WT and PSGL‐1−/− mice. B, Absolute numbers of immune cell populations found in the whole lungs of female WT and PSGL‐1−/− mice. C, Absolute numbers of interferon‐γ (IFNγ)–positive cells obtained from the whole lungs of female WT and PSGL‐1−/− mice. D, Percentage of interleukin‐10 (IL‐10)– and IFNγ‐producing cells in the B cell and T cell populations and the frequency of Treg cells (FoxP3+) in the CD4+ T cell subset in lungs isolated from mice (n = 4–6 per group). Symbols represent individual mice; bars show the mean ± SEM. * = P < 0.05; ** = P < 0.01, by Student’s 2‐tailed t‐test with Bonferroni post hoc test. AM = alveolar macrophages; MФ = interstitial macrophages; DC = dendritic cells; Neut. = neutrophils.
