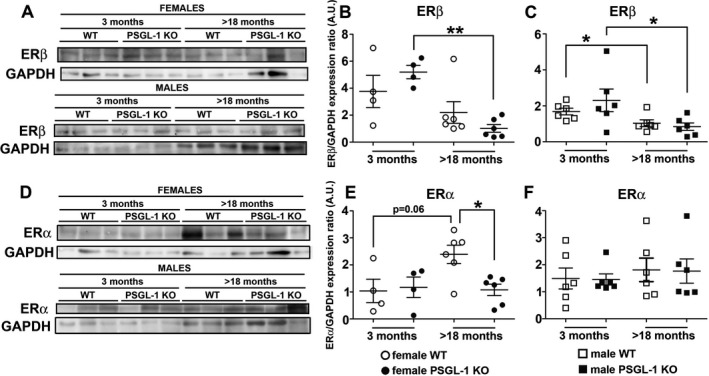
Figure 6.

Analysis of estrogen receptor β (ERβ) and ERα expression in the lungs of mice. A–C, Western blot (A) and quantification of the expression of ERβ in the lungs of female (B) and male (C) wild‐type (WT) and PSGL‐1−/− mice. D–F, Representative Western blot (D) and quantification of the expression of ERα in the lungs of female (E) and male (F) WT and PSGL‐1−/− mice. Symbols represent individual mice; bars show the mean ± SEM. * = P < 0.05; ** = P < 0.01, by Mann‐Whitney U‐test.
