
Figure 3.
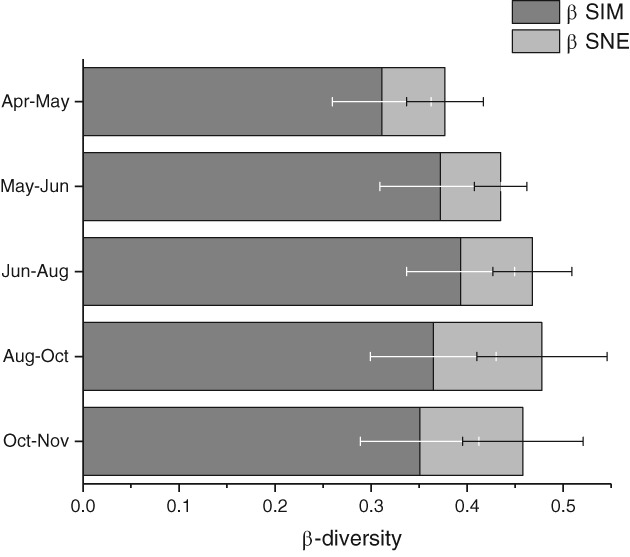
Patterns of variability within AMF assemblages across the studied plot from one time point to the next. Stacked bars represent overall beta‐diversity (βSOR) observed in the partial data sets, computed using the R package betapart (Baselga & Orme, 2012); dark grey sections of the bars represent the contribution of the turnover of AMF (βSIM), light grey sections account for the nestedness of AMF (βSNE); error bars represent variability between SCALEMIC subplots.