
Figure 3.
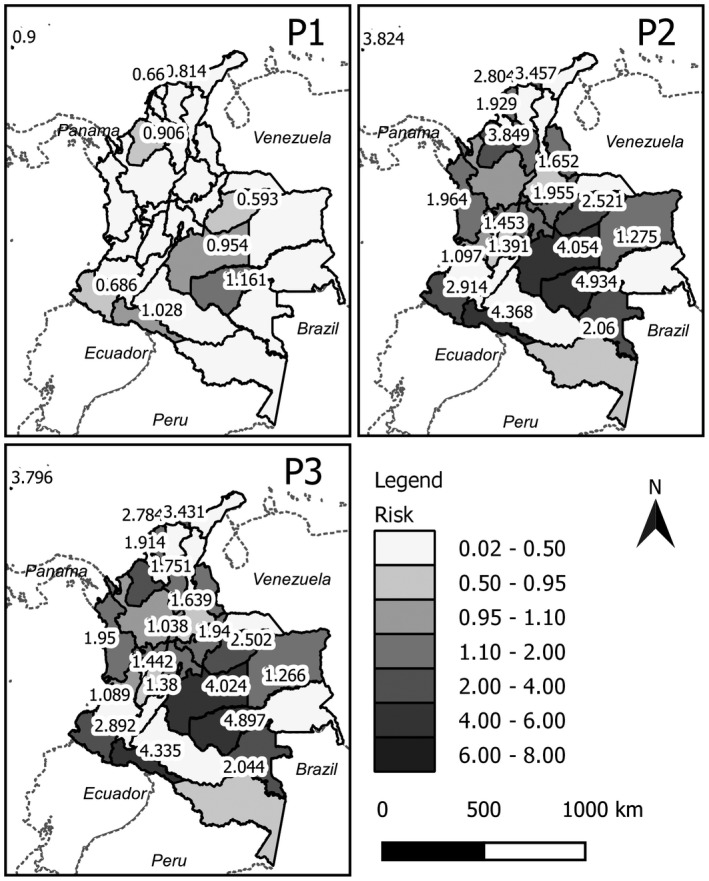
Maps of estimated spatial risk using the convolution model for Zika virus disease in Colombia by time period (P1: weeks 32–52 of 2015; P2: weeks 1–28 of 2016; P3: weeks 29–52 of 2016).
Official websites use .gov
A
.gov website belongs to an official
government organization in the United States.
Secure .gov websites use HTTPS
A lock (
) or https:// means you've safely
connected to the .gov website. Share sensitive
information only on official, secure websites.
Maps of estimated spatial risk using the convolution model for Zika virus disease in Colombia by time period (P1: weeks 32–52 of 2015; P2: weeks 1–28 of 2016; P3: weeks 29–52 of 2016).