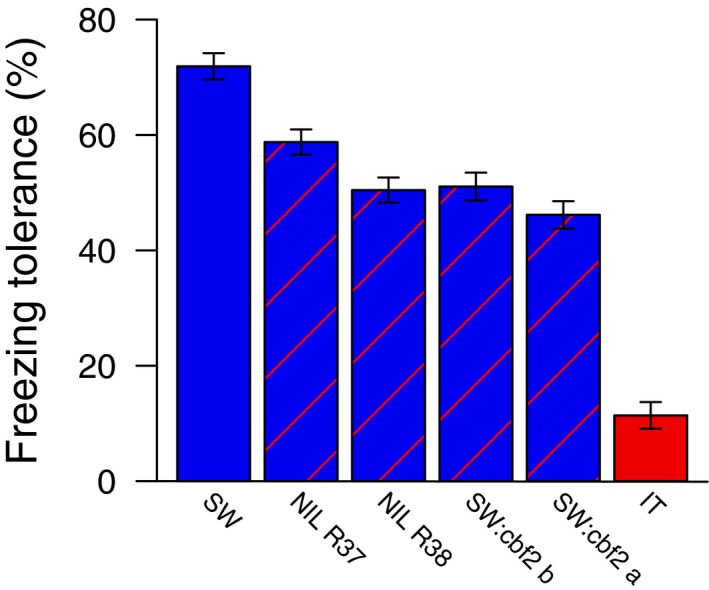
Figure 1.

Mean freezing tolerance of the SW and IT ecotypes and the two NILs and two CRISPR mutant lines containing CBF2 loss‐of‐function alleles in the SW background. Error bars are 1 SE. Linear contrasts comparing SW to each of the other lines were all highly significant (Table 1).
