Figure 3.

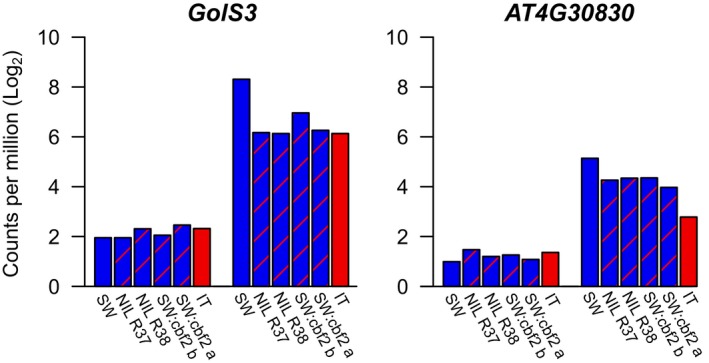
Log2 counts per million for the most highly cold‐responsive genes of the 10 candidates before (left group of bars) and after (right group of bars) cold acclimation.

Log2 counts per million for the most highly cold‐responsive genes of the 10 candidates before (left group of bars) and after (right group of bars) cold acclimation.