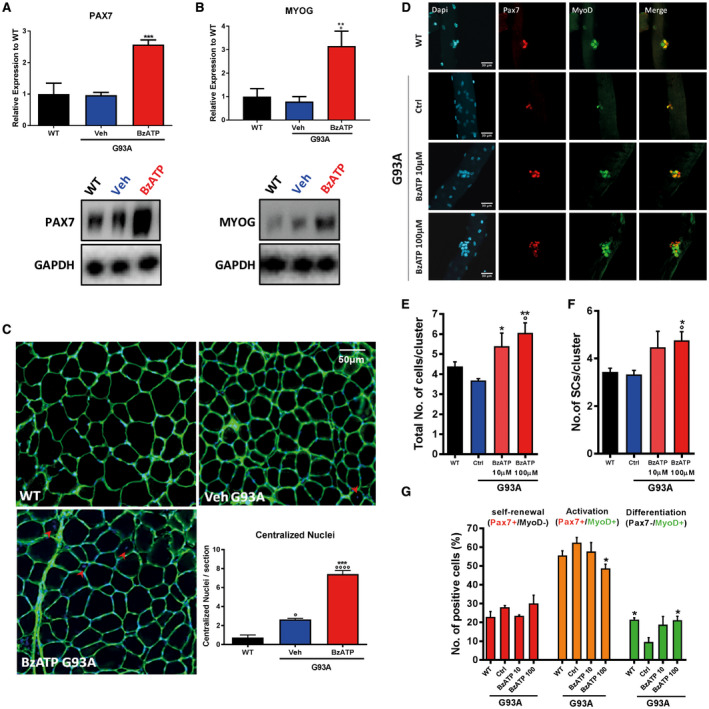
Figure 3.

BzATP enhances the activation of myogenic satellite cells in skeletal muscles of mSOD1 mice. An equal amount of total tibialis anterior (TA) muscle lysates from WT and vehicle‐ or BzATP‐treated mSOD1 mice at pre‐symptomatic stage (n = 4/group) were subjected to western blotting with A. anti‐PAX7 and B. anti‐MYOG. GAPDH was used for protein normalization. C. Transverse muscle sections from mSOD1 mice at the 112 days were histochemically stained for the count of centralized nuclei (indicated with red arrows). Data represent means ± SEM. Statistical significance was calculated by one‐way ANOVA with Tukey's post‐analysis or Student's t‐test, as referred to WT, °P < 0.05; °°P < 0.01; °°°P < 0.001; °°°°P < 0.0001 or to vehicle mice *P < 0.05; **P < 0.01; ***P < 0.001. D. Myofibers from WT and mSOD1 mice treated with vehicle, BzATP 10 mM and BzATP 100 mM were stained (after 72 h in culture) with anti‐Pax7 and anti‐MyoD. DAPI was used to identify all myofibers nuclei. The graphs represent the quantification of the total number of cells/cluster (E), the number of SCs/cluster (F) and the distribution of self‐renewing (in red, Pax7+/MyoD‐), activated (in yellow, Pax7+/MyoD+) and differentiating cells (in green, Pax7‐/MyoD+) in myofibers (G). Data represent means ± SEM. Statistical significance was calculated by one‐way ANOVA with Tukey's post‐analysis or Student's t‐test, as referred to WT fibers, °P < 0.05; or to ctrl G93A fibers, *P < 0.05; **P < 0.01.
