
Figure 4.
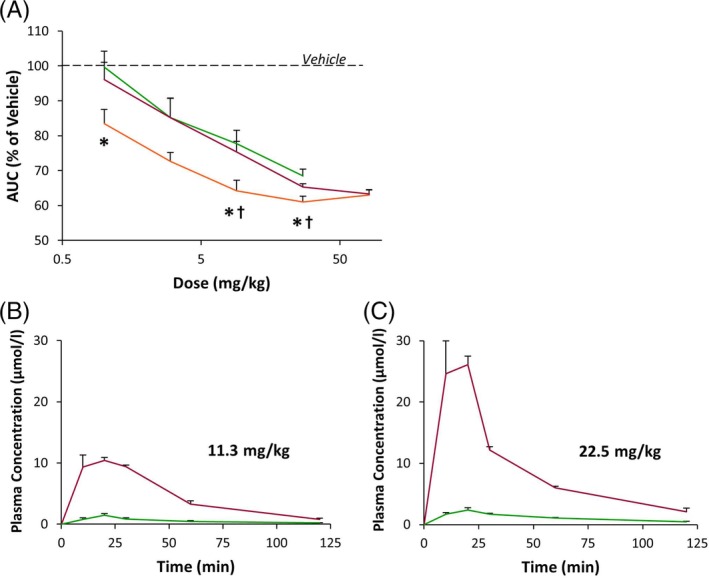
A, Dose‐dependent effects of 55P0251 (orange), 55P0297 (green) and 55P0399 (red) on areas under the glucose curves (AUCs) from oral glucose tolerance tests (OGTTs) performed in mice 45 minutes after a single oral dose of the respective compound. Data given in % of the mean value obtained in vehicle‐treated control mice. Means ± SEM; n = 8‐9 each; *P < .05 vs 55P0297; †P < .05 vs 55P0399. B, Plasma concentrations in mice of 55P0297 (green) and 55P0399 (red) after an oral dose of 11.3 mg/kg (left graph) or 22.5 mg/kg 55P0399 (right graph). Means ± SEM; n = 3 each