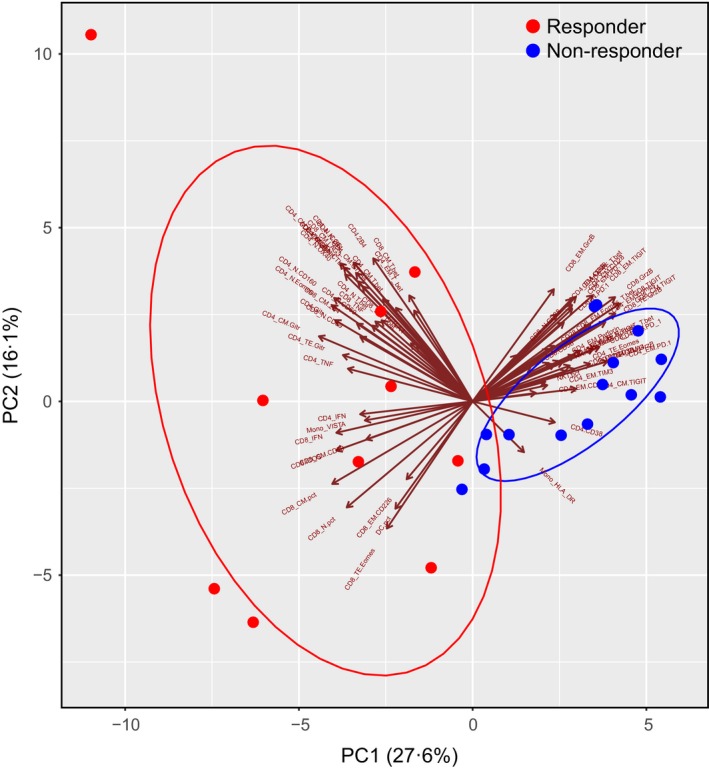
Figure 3.

Unsupervised PCA for immune markers showed distinct patterns between the responders and non‐responders to decitabine treatment. Flow cytometry analyses of immune phenotypes and functions were performed on peripheral blood mononuclear cells from responders (n = 10) and non‐responders (n = 14). Seventy‐three parameters including the frequencies of each immune cell population and its subsets, as well as their phenotype, function and transcription factors were analysed through principal component analysis (PCA) algorithms into two components, PC1 and PC2. Cell profiles of responders and non‐responders were superimposed on the PCA plot. The circles exhibit the two clusters of patients. The direction and length of the arrow represents the contribution and degree of a parameter to each component.
