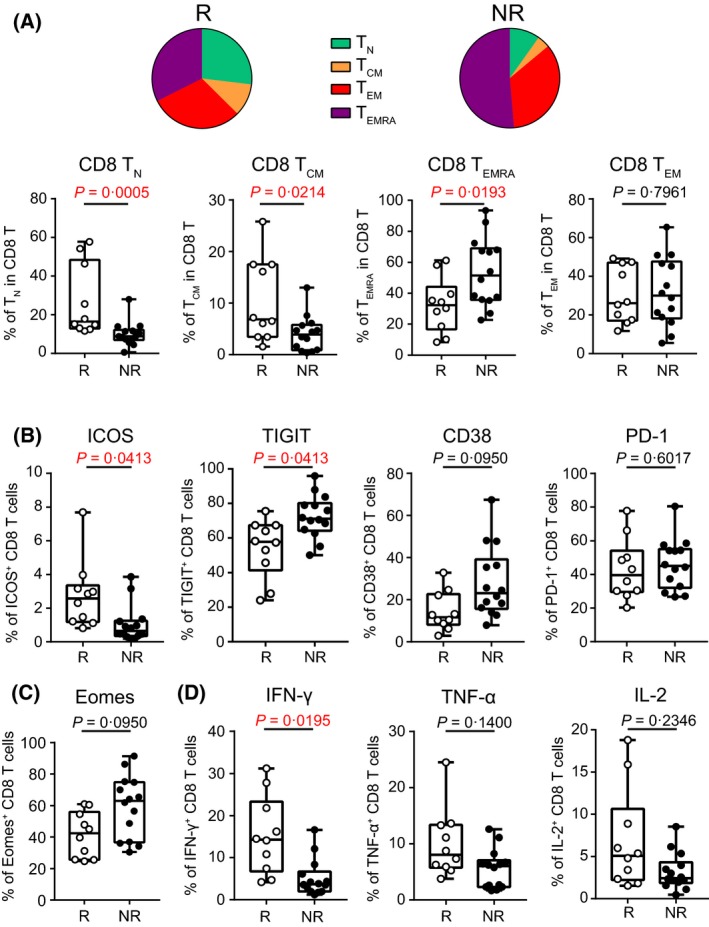
Figure 4.

High functional T cell status associates with good clinical response to decitabine in AML. Cell components, phenotypes and functions were compared between the responders (R, n = 10) versus non‐responders (NR, n = 14). (A) Shown are the frequencies of TN, TCM, TEM, TEMRA subsets among CD8 T cells. The pie charts represent the mean values of each subset. The box‐and‐whiskers plots depict the summary of data from all patients. Each spot represents an individual patient. (B) Surface expression of co‐stimulatory or co‐inhibitory molecules on CD8 T cells are shown. (C) Shown is the intracellular expression of transcription factor EOMES on CD8 T cells. (D) Production of IFN‐γ, TNF‐α, and IL‐2 by CD8 T cells upon in vitro stimulation with anti‐CD3 and anti‐CD28 antibodies. For A, P‐values were calculated using Wilcoxon rank‐sum tests. For (B–D), total of 26 immune markers, including activation molecules, co‐stimulatory or inhibitory receptors, and transcriptional factors, were tested on CD8 T cells (Table S5). P‐values were calculated using Wilcoxon rank‐sum tests and were corrected for the multiple comparison using the Benjamini‐Hochberg adjustment. The numbers shown here indicate adjusted P‐values. No statistical significance was detected in other markers. TCM, CCR7+CD45RA− central memory T cells; TEM, CCR7−CD45RA− effector memory T cells; TEMRA, CCR7−CD45RA+ terminally differentiated effector T cells; TN, CCR7+CD45RA+ naïve T cells.
