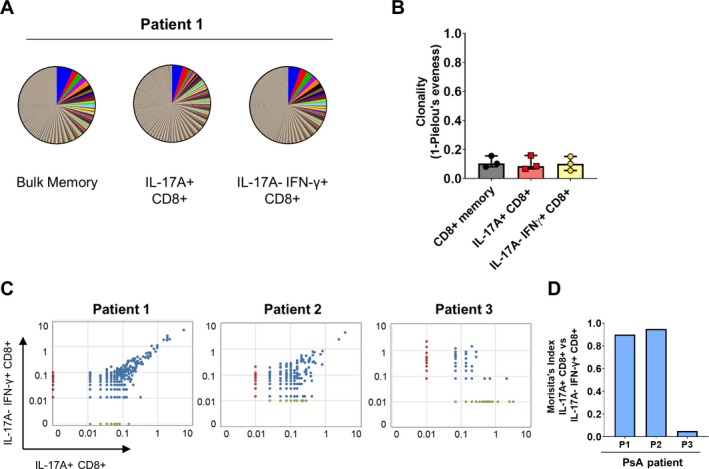
Figure 2.

Diverse T cell receptor (TCR) repertoire in synovial Tc17 cells. A, Representative pie charts with segments representing the frequencies of all TCRβ sequences in bulk memory CD8+ T cells, CD8+ T cells positive for interleukin‐17A (IL‐17A), and CD8+ T cells negative for IL‐17A and positive for interferon‐γ (IFNγ) in a patient with psoriatic arthritis (PsA). B, Clonality score (defined as 1 − Pielou's evenness) for bulk memory CD8+, IL‐17A+CD8+, and IL‐17A−IFNγ+CD8+ T cells in PsA synovial fluid samples (n = 3). Symbols represent individual patients; bars show the median and interquartile range. C and D, Dot plots (C) and Morisita's index (D) showing the degree of clonal overlap between IL‐17A+CD8+ and IL‐17A−IFNγ+CD8+ T cells in 3 patients with PsA. Color figure can be viewed in the online issue, which is available at http://onlinelibrary.wiley.com/doi/10.1002/art.41156/abstract.
