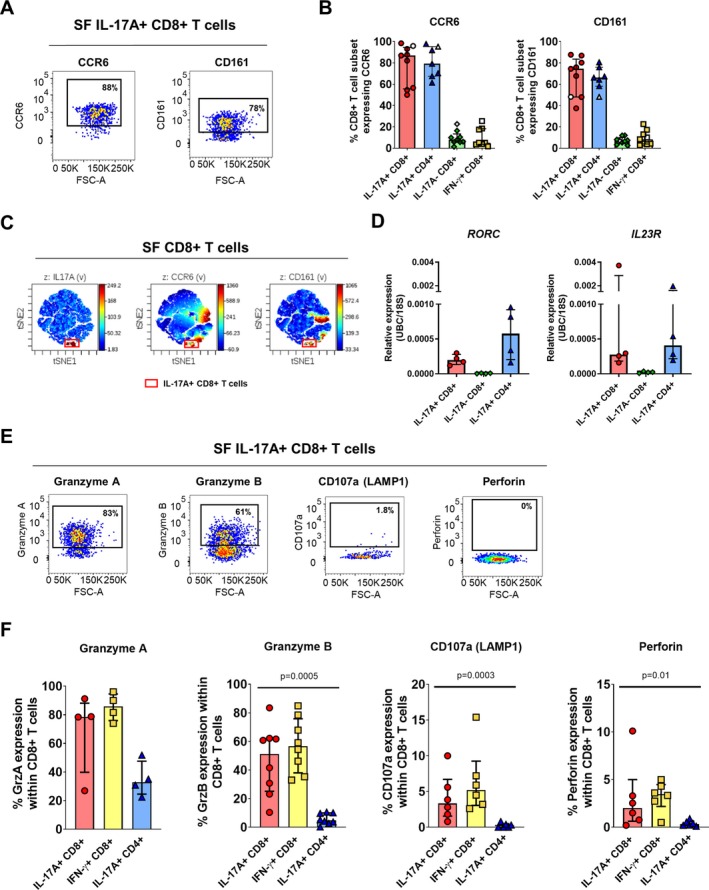
Figure 4.

Synovial Tc17 cells have functional hallmarks of Th17 and Tc1 cells. A and B, Representative staining (A) and cumulative data (B) showing the frequencies of IL‐17A+CD8+, IL‐17A+CD4+, IL‐17A−CD8+, and IFNγ+CD8+ T cells expressing CCR6 and CD161 in synovial fluid mononuclear cells (SFMCs) from patients with PsA (solid symbols) and patients with other types of spondyloarthritis (open symbols) (n = 7–9). C, Representative viSNE plot showing concomitant expression of IL‐17A, CCR6, and CD161 among CD8+ T cells in PsA SFMCs. Representative results from 1 of 7 patients are shown. D, Gene expression levels of RORC and IL23R, normalized to the average values for UBC and 18S in sorted IL‐17A+CD8+, IL‐17A−CD8+, and IL‐17A+CD4+ T cells from PsA SFMCs (n = 4). E and F, Representative staining (E) and cumulative data (F) showing the frequencies of IL‐17A+CD8+, IFNγ+CD8+, and IL‐17A+CD4+ T cells expressing granzyme A (GrzA; n = 4), granzyme B (GrzB; n = 9), CD107a/lysosomal‐associated membrane protein 1 (LAMP‐1; n = 6), and perforin (n = 6) in PsA SFMCs. P values were determined by Friedman's multiple comparisons test. In B, D, and F, symbols represent individual patients; bars show the median and interquartile range. See Figure 2 for other definitions. Color figure can be viewed in the online issue, which is available at http://onlinelibrary.wiley.com/doi/10.1002/art.41156/abstract.
