Figure 6.

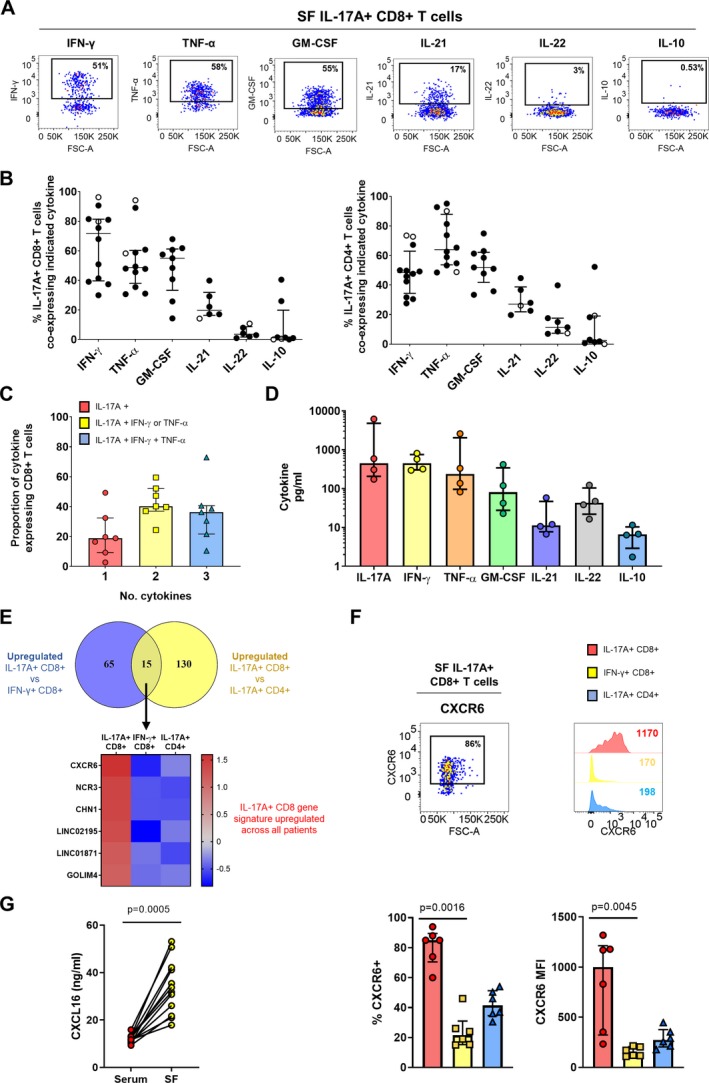
Synovial Tc17 cells are polyfunctional proinflammatory cells characterized by high expression of CXCR6. A and B, Representative staining (A) and cumulative data (B) showing the frequencies of IL‐17A+CD8+ (left) and IL‐17A+CD4+ (right) T cells expressing IFNγ (n = 12), tumor necrosis factor (TNF; n = 12), granulocyte–macrophage colony‐stimulating factor (GM‐CSF; n = 9), IL‐21 (n = 6), IL‐22 (n = 6), and IL‐10 (n = 8) in synovial fluid mononuclear cells (SFMCs) from patients with PsA (solid symbols) or other types of spondyloarthritis (open symbols). C, Proportion of IL‐17A+CD8+ T cells expressing IL‐17A alone, IL‐17A plus IFNγ or TNF, and IL‐17A plus IFNγ and TNF. D, IL‐17A, IFNγ, TNF, GM‐CSF, IL‐21, IL‐22, and IL‐10 secretion by sorted synovial IL‐17A+CD8+ T cells (n = 4). E, Top, Venn diagram showing the number of significantly up‐regulated genes (P < 0.01) in IL‐17A+CD8+ T cells versus IFNγ+CD8+ T cells and in IL‐17A+CD8+ T cells versus IL‐17A+CD4+ T cells. Bottom, Heatmap showing genes that were consistently up‐regulated in all patients. F, Representative dot plot and histograms (top) and cumulative data (bottom) showing the percentage of CXCR6+ cells and CXCR6 expression levels in PsA synovial IL‐17A+CD8+ T cells, IFNγ+CD8+ T cells, and IL‐17A+CD4+T cells (n = 6). P values were determined by Friedman's multiple comparisons test. G, CXCL16 levels in paired PsA serum and SF samples (n = 12) as measured by enzyme‐linked immunosorbent assay. P value was determined by Wilcoxon's matched pairs signed rank test. In C and D, bars show the median and interquartile range. MFI = mean fluorescence intensity (see Figure 2 for other definitions). Color figure can be viewed in the online issue, which is available at http://onlinelibrary.wiley.com/doi/10.1002/art.41156/abstract.
