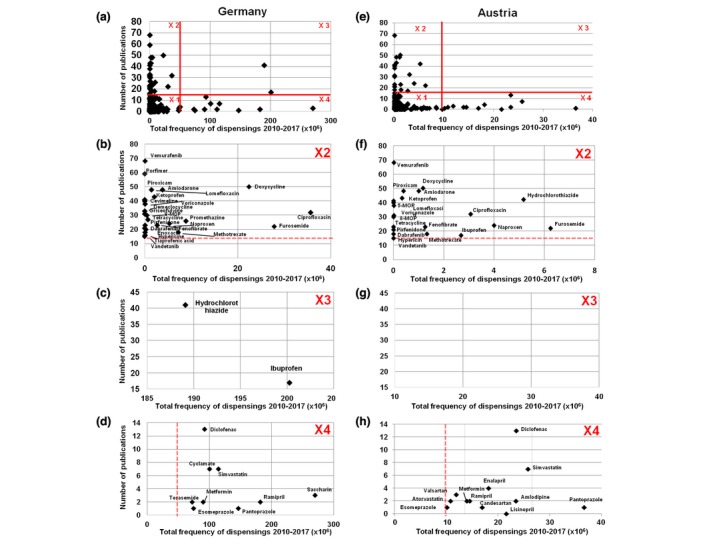
Figure 3.

Combined analysis of drug dispensings and reference score. Scatterplot of the total number of dispensings of each single agent plotted against the number of publications (‘reference score’) in Germany (DE) (a–d) and Austria (AT) (e–h). The resulting diagram in (a) and (e) is subdivided into four segments each (‘X1’–‘X4’). In the subfigures b–d and f–h, a detailed analysis of ‘X2’–‘X4’ is shown.
