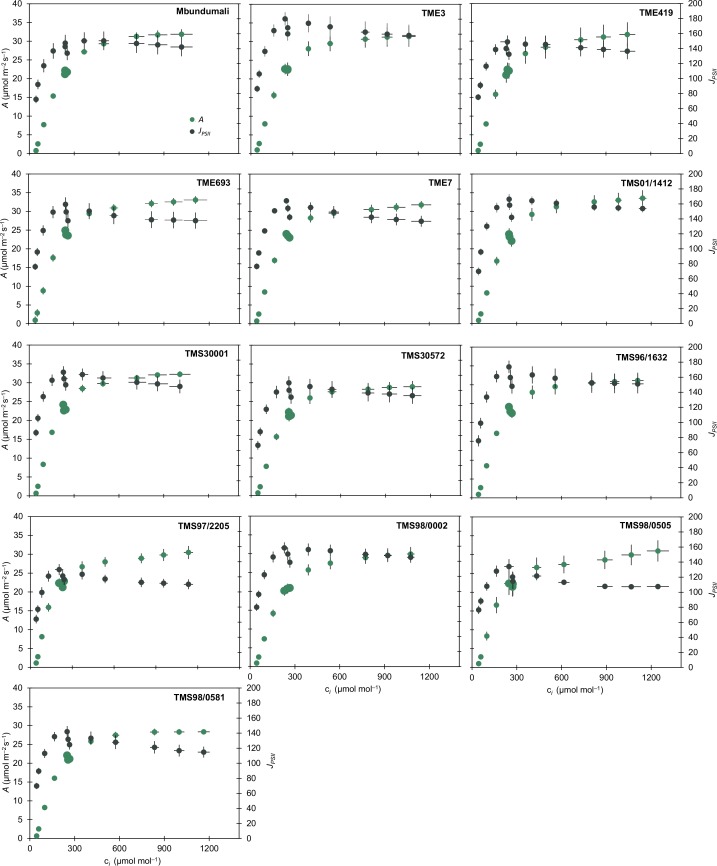
Fig. 1.
Response of light-saturated (c. 1500 μmol m−2 s−1) leaf carbon assimilation (A, μmol m−2 s−1; green) and of electron transport rate (JPSII, μmol m−2 s−1; black) to intracellular CO2 concentration (ci, μmol mol−1) in cassava cultivars. Symbols represent mean ± SE. n = 8, except for TMS98/0505 and TMS97/2205 where n = 4. Larger symbols indicate the operating point, which is the ci achieved when the ambient [CO2] around the leaf is 400 μmol mol−1.

