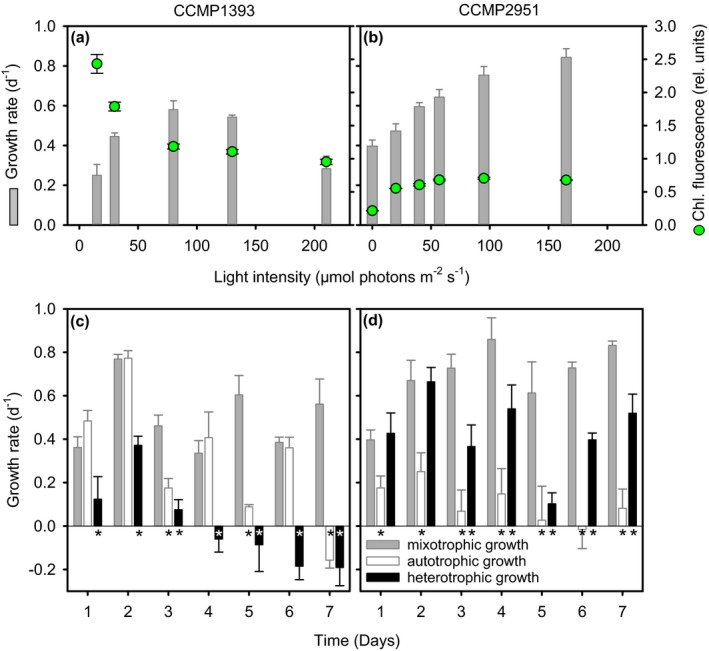
Figure 2.

Growth responses to light under prey‐amended conditions in the two Ochromonas isolates. (a and b) Light–response curves and cellular chlorophyll a fluorescence of CCMP1393 and CCMP2951 during prey‐amended growth in the light (mixotrophic growth; Experiment 1). Cultures were maintained semi‐continuously with daily additions of Vibrio fischeri as prey. (c and d) Growth curves of CCMP1393 and CCMP2951 (Experiment 2) with daily prey‐amendments in the light (mixotrophic growth), with daily prey‐amendments in darkness (heterotrophic growth), or after ceasing prey‐amendments in the light (autotrophic growth). Asterisk indicates significant difference from mixotrophic conditions (P < 0.05; Holm‐Sidak test following a two‐way repeated measures ANOVA). Error bars indicate standard deviation among biological triplicates. [Color figure can be viewed at http://www.wileyonlinelibrary.com]
