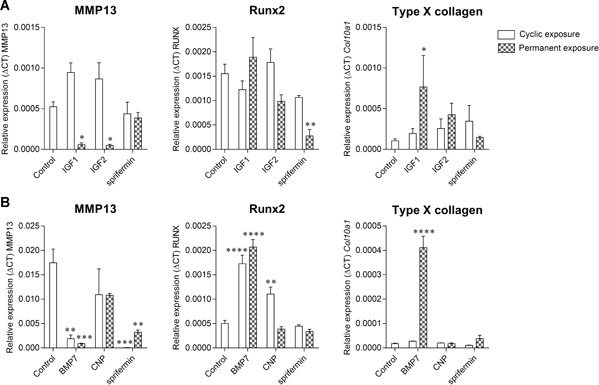
Figure 5.

Gene expression of chondrocytes in three‐dimensional (3D) constructs. Relative expression of mmp13, runx2, and col10a1 in 3D constructs after 4 weeks of culture with cyclic or permanent exposure to (A) Insulin‐like growth factor 1 (IGF1), IGF2, or sprifermin or (B) bone metamorphic protein 7 (BMP7), C‐type natriuretic peptide (CNP), and sprifermin. *p ≤ 0.05; **p ≤ 0.01; ***p ≤ 0.001; ****p ≤ 0.0001 versus control (culture medium only).
