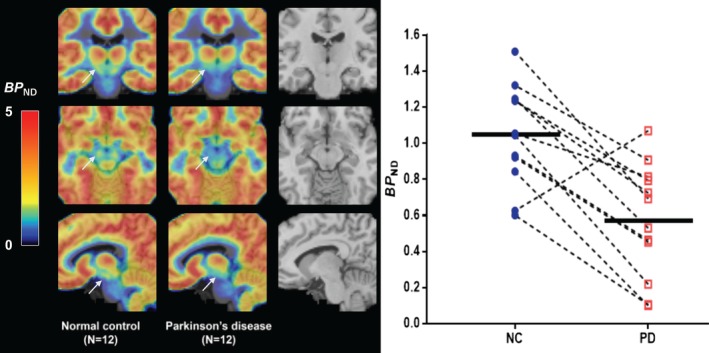
Figure 3.

(A) The midbrain area with arrows denoting the substantia nigra (SN) is shown on the averaged group parametric images of [11C]UCB‐J binding potential (BP ND) values between normal control (NC; left) and Parkinson disease (PD; center) subjects. The color scale denotes BP ND. The magnetic resonance imaging template is also shown for comparison purpose (right). (B) Scatterplot results of SN between NC (blue circles) and PD (red squares) subjects. Connected lines indicate demographically matched subjects. Horizontal bars indicate group means.
