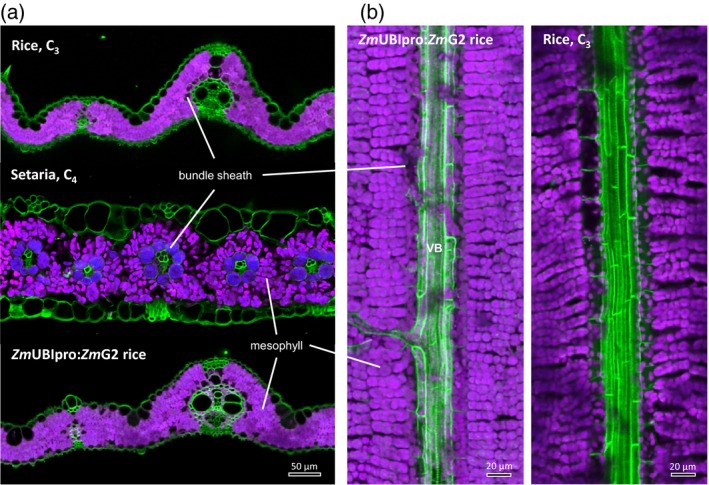
Figure 2.

Confocal micrographs of fresh hand‐cut transverse (a) and paradermal (b) leaf sections of Oryza sativa (rice), Setaria viridis (Setaria), and a rice line with constitutively expressed GOLDEN2 transcription factor from Zea mays (ZmUBIpro:ZmG2 rice). Excitation wavelength at 633 nm and dual emission wavelengths at 650–720 nm (magenta for Photosystem II) and 720–800 nm (blue for Photosystem I) were used to visualise chloroplasts. Note that bundle sheath cells of Setaria leaf have chloroplasts appearing pseudo‐blue due to reduced Photosystem II content. Cell wall (green) was visualised at an excitation wavelength of 405 nm and emission wavelength of 420–480 nm. VB, vascular bundle.
