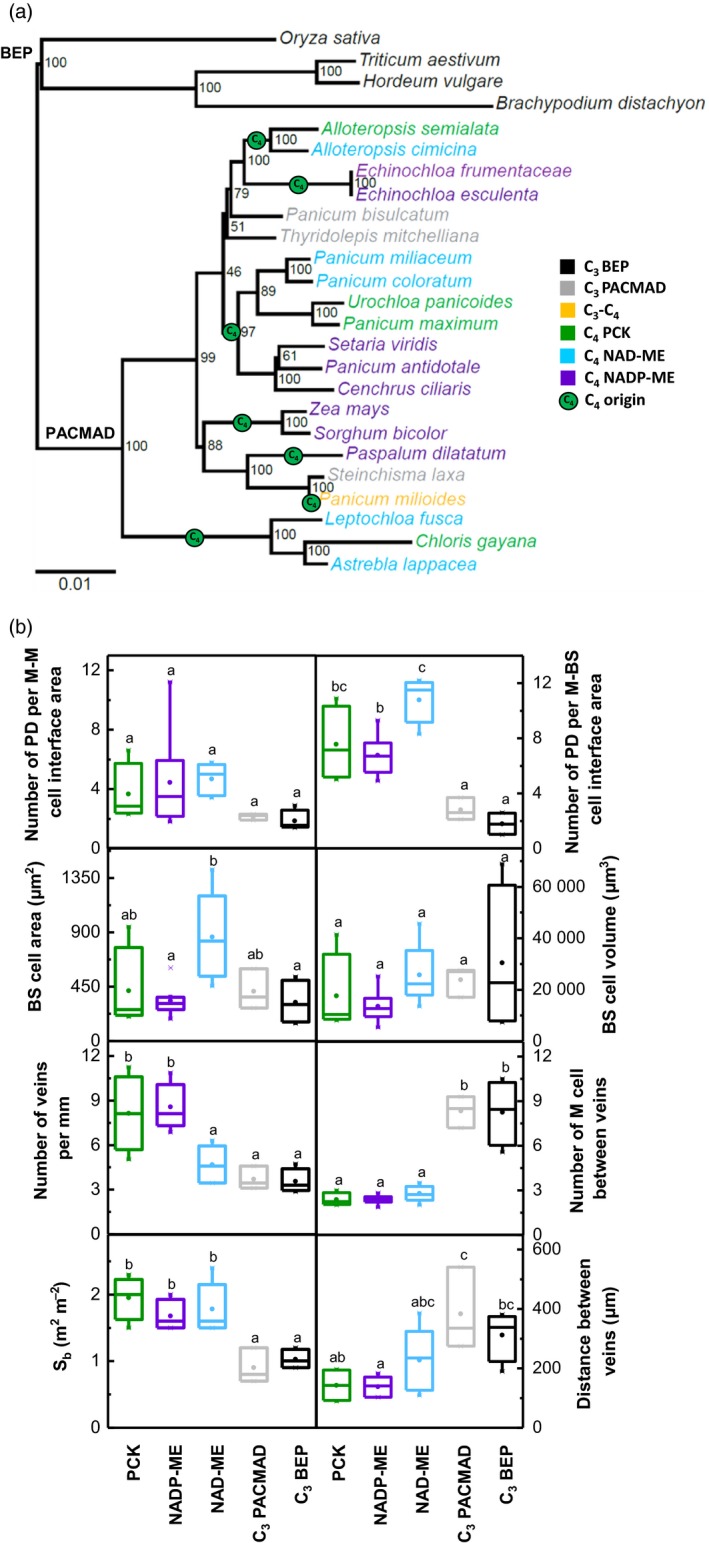
Figure 4.

(a) Phylogenetic tree of the C3 and C4 grass species examined generated using sequences from ndhF and rbcL chloroplast genes. Species names are colour‐coded according to photosynthetic types. The seven independent evolutionary origins of C4 photosynthesis according to (GPWGII, 2012) are indicated with green circles at the midpoint of the branches. Note that Panicum milioides, a.k.a. Steinchisma hians, although technically a C3–C4 intermediate (Duvall et al., 2003) was categorised as C4 in GPWGII (2012). Numerical value at internal nodes is the percentage of non‐parametric bootstrap replicates that support the bipartition. Scale bar indicates amino acid substitutions per site.
(b) Distribution of leaf trait values among photosynthetic types in (a) excluding the C3–C4 intermediate type, in which only one species was measured. The distribution of eight variables is summarised by boxplots. Box and whiskers represent the 25 to 75 percentile, and the minimum and maximum distribution. Means are denoted by (•). Letters show the statistical ranking using a post‐hoc Tukey test among photosynthetic types (different letters indicate differences at P‐value < 0.05). BS, bundle sheath; M, mesophyll; PD, plasmodesmata; Sb, bundle sheath surface area per unit leaf area.
