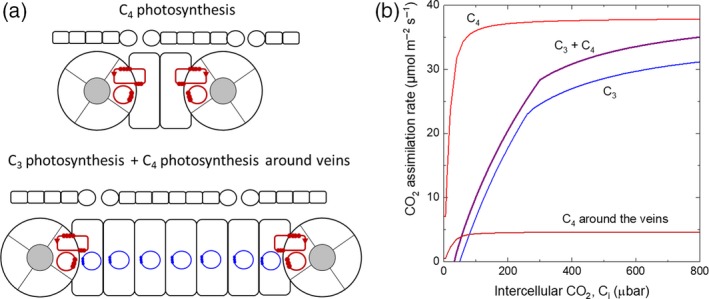
Figure 6.

(a) Diagram comparing two cell‐type C4 photosynthesis and a rice leaf with low capacity C4 photosynthesis occurring around the veins. In the latter, C3 photosynthesis occurs in all mesophyll cells (rectangular cells) and in bundle sheath cells (cells inside circles), in addition to C4 photosynthesis occurring only in mesophyll cells adjacent to bundle sheath cells. (b) Modelled CO2 assimilation rates of a rice leaf with low capacity C4 photosynthesis occurring around the veins (purple line). Also shown are rice leaf with C3 photosynthesis (blue line), a standard high capacity C4 photosynthesis (red line), and the C4 photosynthesis around the vein contributing to the enhanced photosynthesis rate of the purple line (dark red line). C3 leaf photosynthesis has been modelled with RuBisCO maximal activity, Vcmax = 90 µmol m−2 sec−1 and electron transport rate, J = 150 µmol m−2 sec−1. The standard C4 photosynthesis was modelled with Vcmax = 40 µmol m−2 sec−1 and PEP carboxylase maximal activity, Vpmax = 300 µmol m−2 sec−1. The low capacity C4 photosynthesis around the veins was modelled with Vcmax = 5 µmol m−2 sec−1 and Vpmax = 25 µmol m−2 sec−1. In the combined C3 and C4 photosynthesis, the total Vcmax was maintained at 90 µmol m−2 sec−1. C3 RuBisCO kinetic constants by von Caemmerer (2000) were used together with the Michaels constant for CO2 of PEPC of 154 µbar (Boyd et al., 2015).
