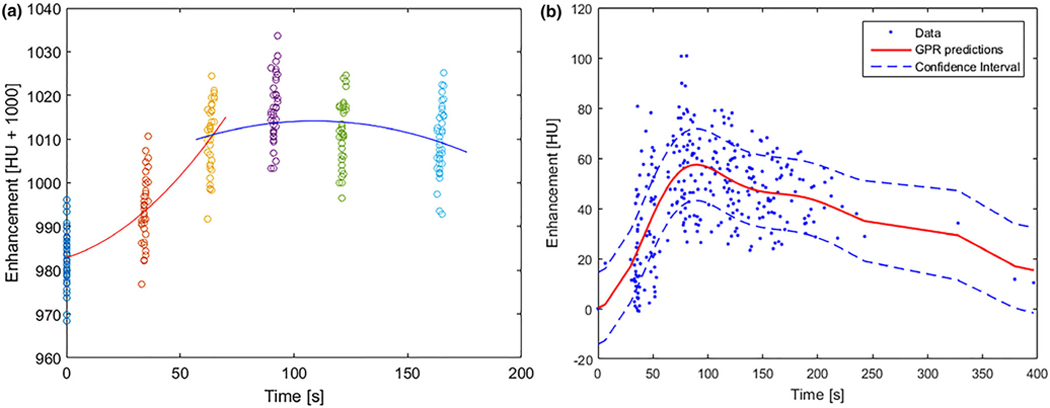
FIG. 2.
(a) An example of modeling a patient-specific enhancement profile of normal liver: two piecewise second-order polynomial functions (orange and blue lines) are used to fit the sampled HU numbers at each phase (colored dots). (b) Population-based enhancement profile of normal liver generated using liver samples collected from multiphase computed tomography datasets of pancreatic cancer patients with no known liver disease: each dot represents sampled HU values from the population, and the dotted blue line represents the 90% interval of the red median curve.

