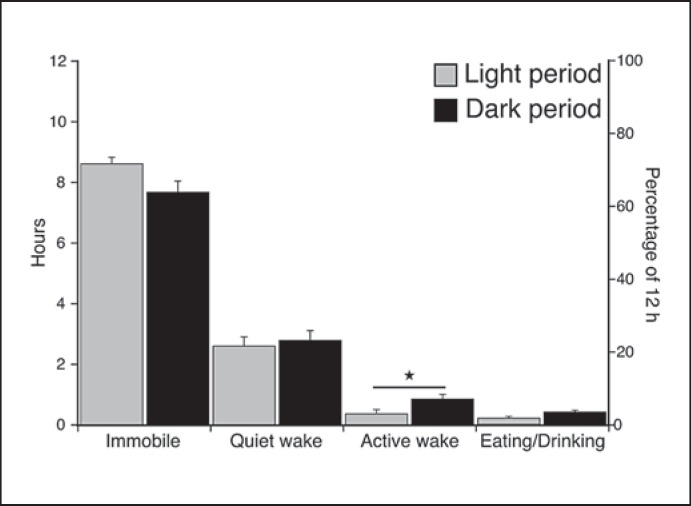
Fig. 9.
Histogram illustrating the species mean for the percentage of time occupied by each behavioral state for the 72-hour recording period during the light and dark period, respectively. There is no statistically significant difference in the distribution of immobility, quiet waking and eating/drinking behaviors between the light and dark periods; however, a statistically significant difference was noted with regard to active waking. More active waking was noted during the dark compared to the light period (t test for dependent variables, d.f. = 4, p < 0.05; please refer to the ‘Results’ section for respective t and p values). Although not statistically significant, there was also a tendency to more eating/drinking behavior during the dark period. Statistically significant results are indicated by a star.

