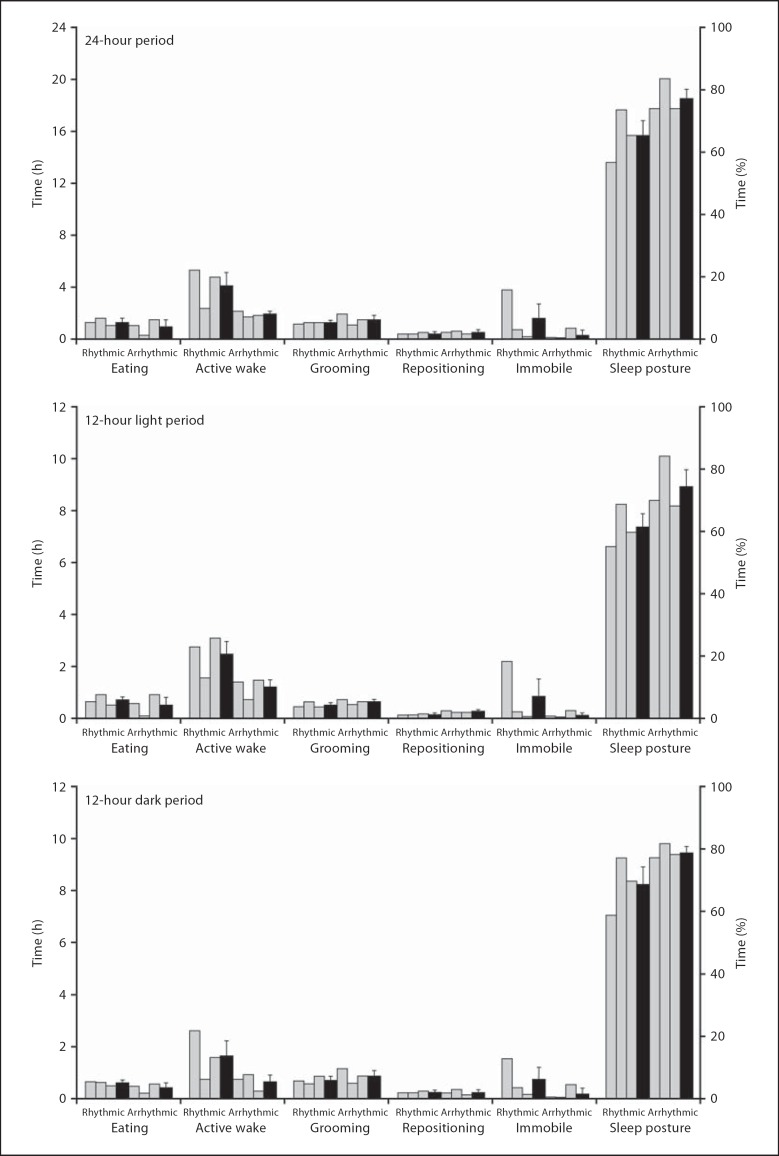
Fig. 2.
Graphs showing data for the various behavioural states in rhythmic and arrhythmic individuals (grey bars, same individuals from left to right in each graph and in all subsequent similar graphs) and the respective weighted means (black bars). The graphs represent the percentage and average amount of time spent in the various behavioural states for a 24-hour cycle (from 72 h of recording) and for the 12-hour light and dark periods (from 36 h of recording).

