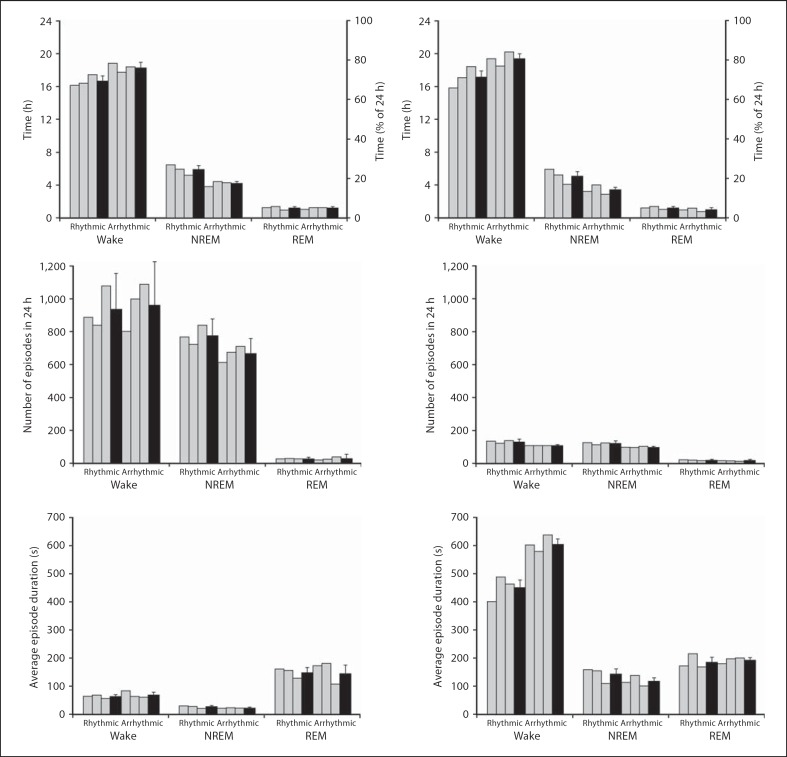
Fig. 6.
Graphs illustrating physiological data (5-second epoch scoring, left column, and 1-min epoch scoring, right column) for sleep and wake states during a 24-hour cycle in rhythmic and arrhythmic individuals (grey bars) and the respective weighted means (black bars). The graphs indicate percentage and the average amount of time that is spent in wake or sleep states, the average number of episodes for wake and sleep states and the average duration of an episode in wake and sleep states.

