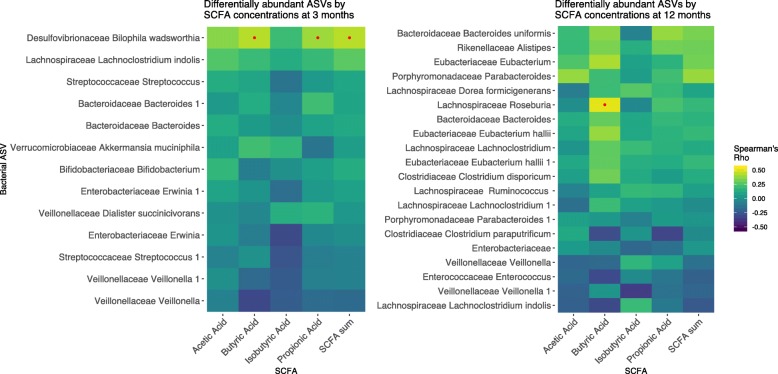
Fig. 3.
Spearman correlations of the four most abundant fecal SCFAs and total SCFA concentrations with the relative abundances of 3- and 12-month gut microbiota ASVs that were significantly associated with timing of introduction to complementary foods in multivariable-adjusted models. *Yellow indicates a positive correlation, while dark blue indicates a negative correlation. Red dots indicate correlations with FDR-adjusted p value < 0.05

