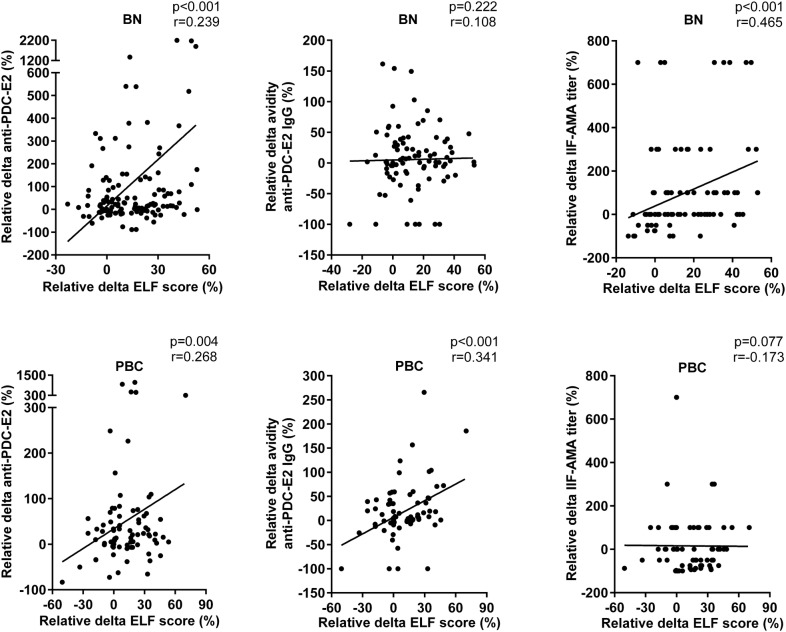
Fig. 3.
Positive correlation between longitudinal increase in AMA and ELF score. Relative delta: difference between any time point station and baseline value divided by baseline value. Dots represent individuals in each group. The line represents the linear trend regarding the distribution of points

