

Abstract
Background
Alcohol use disorder (AUD) confers a prodigious burden of disease, disability, premature mortality, and high economic costs from lost productivity, accidents, violence, incarceration, and increased healthcare utilization. For over 80 years, Alcoholics Anonymous (AA) has been a widespread AUD recovery organization, with millions of members and treatment free at the point of access, but it is only recently that rigorous research on its effectiveness has been conducted.
Objectives
To evaluate whether peer‐led AA and professionally‐delivered treatments that facilitate AA involvement (Twelve‐Step Facilitation (TSF) interventions) achieve important outcomes, specifically: abstinence, reduced drinking intensity, reduced alcohol‐related consequences, alcohol addiction severity, and healthcare cost offsets.
Search methods
We searched the Cochrane Drugs and Alcohol Group Specialized Register, Cochrane Central Register of Controlled Trials (CENTRAL), PubMed, Embase, CINAHL and PsycINFO from inception to 2 August 2019. We searched for ongoing and unpublished studies via ClinicalTrials.gov and the World Health Organization (WHO) International Clinical Trials Registry Platform (ICTRP) on 15 November 2018. All searches included non‐English language literature. We handsearched references of topic‐related systematic reviews and bibliographies of included studies.
Selection criteria
We included randomized controlled trials (RCTs), quasi‐RCTs and non‐randomized studies that compared AA or TSF (AA/TSF) with other interventions, such as motivational enhancement therapy (MET) or cognitive behavioral therapy (CBT), TSF treatment variants, or no treatment. We also included healthcare cost offset studies. Participants were non‐coerced adults with AUD.
Data collection and analysis
We categorized studies by: study design (RCT/quasi‐RCT; non‐randomized; economic); degree of standardized manualization (all interventions manualized versus some/none); and comparison intervention type (i.e. whether AA/TSF was compared to an intervention with a different theoretical orientation or an AA/TSF intervention that varied in style or intensity). For analyses, we followed Cochrane methodology calculating the standard mean difference (SMD) for continuous variables (e.g. percent days abstinent (PDA)) or the relative risk (risk ratios (RRs)) for dichotomous variables. We conducted random‐effects meta‐analyses to pool effects wherever possible.
Main results
We included 27 studies containing 10,565 participants (21 RCTs/quasi‐RCTs, 5 non‐randomized, and 1 purely economic study). The average age of participants within studies ranged from 34.2 to 51.0 years. AA/TSF was compared with psychological clinical interventions, such as MET and CBT, and other 12‐step program variants.
We rated selection bias as being at high risk in 11 of the 27 included studies, unclear in three, and as low risk in 13. We rated risk of attrition bias as high risk in nine studies, unclear in 14, and low in four, due to moderate (> 20%) attrition rates in the study overall (8 studies), or in study treatment group (1 study). Risk of bias due to inadequate researcher blinding was high in one study, unclear in 22, and low in four. Risks of bias arising from the remaining domains were predominantly low or unclear.
AA/TSF (manualized) compared to treatments with a different theoretical orientation (e.g. CBT) (randomized/quasi‐randomized evidence)
RCTs comparing manualized AA/TSF to other clinical interventions (e.g. CBT), showed AA/TSF improves rates of continuous abstinence at 12 months (risk ratio (RR) 1.21, 95% confidence interval (CI) 1.03 to 1.42; 2 studies, 1936 participants; high‐certainty evidence). This effect remained consistent at both 24 and 36 months.
For percentage days abstinent (PDA), AA/TSF appears to perform as well as other clinical interventions at 12 months (mean difference (MD) 3.03, 95% CI ‐4.36 to 10.43; 4 studies, 1999 participants; very low‐certainty evidence), and better at 24 months (MD 12.91, 95% CI 7.55 to 18.29; 2 studies, 302 participants; very low‐certainty evidence) and 36 months (MD 6.64, 95% CI 1.54 to 11.75; 1 study, 806 participants; very low‐certainty evidence).
For longest period of abstinence (LPA), AA/TSF may perform as well as comparison interventions at six months (MD 0.60, 95% CI ‐0.30 to 1.50; 2 studies, 136 participants; low‐certainty evidence).
For drinking intensity, AA/TSF may perform as well as other clinical interventions at 12 months, as measured by drinks per drinking day (DDD) (MD ‐0.17, 95% CI ‐1.11 to 0.77; 1 study, 1516 participants; moderate‐certainty evidence) and percentage days heavy drinking (PDHD) (MD ‐5.51, 95% CI ‐14.15 to 3.13; 1 study, 91 participants; low‐certainty evidence).
For alcohol‐related consequences, AA/TSF probably performs as well as other clinical interventions at 12 months (MD ‐2.88, 95% CI ‐6.81 to 1.04; 3 studies, 1762 participants; moderate‐certainty evidence).
For alcohol addiction severity, one study found evidence of a difference in favor of AA/TSF at 12 months (P < 0.05; low‐certainty evidence).
AA/TSF (non‐manualized) compared to treatments with a different theoretical orientation (e.g. CBT) (randomized/quasi‐randomized evidence)
For the proportion of participants completely abstinent, non‐manualized AA/TSF may perform as well as other clinical interventions at three to nine months follow‐up (RR 1.71, 95% CI 0.70 to 4.18; 1 study, 93 participants; low‐certainty evidence).
Non‐manualized AA/TSF may also perform slightly better than other clinical interventions for PDA (MD 3.00, 95% CI 0.31 to 5.69; 1 study, 93 participants; low‐certainty evidence).
For drinking intensity, AA/TSF may perform as well as other clinical interventions at nine months, as measured by DDD (MD ‐1.76, 95% CI ‐2.23 to ‐1.29; 1 study, 93 participants; very low‐certainty evidence) and PDHD (MD 2.09, 95% CI ‐1.24 to 5.42; 1 study, 286 participants; low‐certainty evidence).
None of the RCTs comparing non‐manualized AA/TSF to other clinical interventions assessed LPA, alcohol‐related consequences, or alcohol addiction severity.
Cost‐effectiveness studies
In three studies, AA/TSF had higher healthcare cost savings than outpatient treatment, CBT, and no AA/TSF treatment. The fourth study found that total medical care costs decreased for participants attending CBT, MET, and AA/TSF treatment, but that among participants with worse prognostic characteristics AA/TSF had higher potential cost savings than MET (moderate‐certainty evidence).
Authors' conclusions
There is high quality evidence that manualized AA/TSF interventions are more effective than other established treatments, such as CBT, for increasing abstinence. Non‐manualized AA/TSF may perform as well as these other established treatments. AA/TSF interventions, both manualized and non‐manualized, may be at least as effective as other treatments for other alcohol‐related outcomes. AA/TSF probably produces substantial healthcare cost savings among people with alcohol use disorder.
Plain language summary
Alcoholics Anonymous (AA) and other 12‐step programs for alcohol use disorder
Review question
This review summarized research comparing the Alcoholics Anonymous (AA) and similarTwelve‐Step Facilitation (TSF) programs (AA/TSF) to other treatments to see if they help people with drinking problems to stay sober, or reduce alcohol consumption and drinking‐related consequences. We also examined whether AA/TSF reduces healthcare costs relative to other treatments.
Background
Alcohol use disorder (i.e. alcoholism) is a concerning individual and public health problem worldwide. Treatment is expensive. AA is a widespread and free mutual‐help fellowship that helps people to recover from alcoholism and to improve their quality of life.
Search date
The evidence is current to 2 August 2019.
Study characteristics
We identified 27 relevant studies that had included 10,565 participants. The studies varied in design; and whether treatments were delivered according to standardized procedures (i.e. manualized); and whether AA/TSF was compared to a treatment that had a different theoretical basis (e.g. cognitive behavioral therapy (CBT)), or to a different type of TSF (i.e. one that varied in style or intensity from the AA TSF).
Study funding sources
The Included studies were funded through one or more grants from the United States National Institutes of Health (18 studies), the USA Department of Veterans Affairs (8 studies), and other organizations (e.g. private foundations or academic institutions; 8 studies). Two studies did not report their source of funding.
Key results
Manualized AA/TSF interventions usually produced higher rates of continuous abstinence than the other established treatments investigated. Non‐manualized AA/TSF performed as well as other established treatments.
AA/TSF may be superior to other treatments for increasing the percentage of days of abstinence, particularly in the longer‐term. AA/TSF probably performs as well as other treatments for reducing the intensity of drinking (of alcohol). AA/TSF probably performs as well as other treatments for alcohol‐related consequences and addiction severity. Four of the five economics studies found substantial cost‐saving benefits for AA/TSF, which indicate that AA/TSF interventions probably reduce healthcare costs substantially.
In conclusion, clinically‐delivered TSF interventions designed to increase AA participation usually lead to better outcomes over the subsequent months to years in terms of producing higher rates of continuous abstinence. This effect is achieved largely by fostering increased AA participation beyond the end of the TSF intervention. AA/TSF will probably produce substantial healthcare cost savings while simultaneously improving alcohol abstinence.
Certainty of evidence
Our certainty in the evidence ranged from very low to high for the different outcomes. Most of the high‐certainty evidence was based on the results from studies with reliable study designs (randomized controlled trials) and good measurement methods. We considered some evidence to be of low certainty, partly because of inadequate methods for deciding which treatment each person in the study was to receive, which can allow factors other than the treatments to affect the results.There was some inconsistency in the evidence across studies that could be due to variation in the clinical characteristics of the participants, times of follow‐up, error in participant recall of certain outcomes, and differences in intervention durations, or therapist effects. Some studies had small sample sizes, which led to less precise estimates of the longest periods of abstinence, and high variability around estimates of drinks per drinking day.
Summary of findings
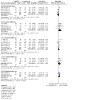
Summary of findings 1. Alcoholics Anonymous (AA)/Twelve‐Step Facilitation (TSF) (manualized) compared to other clinical interventions for alcohol use disorder (1A).
| Alcoholics Anonymous (AA)/Twelve‐Step Facilitation (TSF) (manualized) compared to other clinical interventions for alcohol use disorder (RCT/quasi‐RCT evidence) | |||||||
| Patient or population: adults (> 18 years) with alcohol use disorder, alcohol abuse, or alcohol dependence Setting: outpatient treatment Intervention: AA/TSF (manualized) Comparison: other clinical interventions (e.g. CBT) | |||||||
| Outcomes | Anticipated absolute effects* (95% CI) | Relative effect (95% CI) | № of participants (studies) | Certainty of the evidence (GRADE) | Comments | ||
| Risk with other clinical interventions | Risk with AA/TSF | ||||||
| Abstinence | Proportion of participants (%) completely abstinent Follow‐up: 12 months |
Study population | RR 1.21 (1.03 to 1.42) | 1936 (2 RCTs) | ⊕⊕⊕⊕ High | ||
| 345 per 1000 | 418 per 1000 (356 to 490) | ||||||
| PDA Follow‐up: 12 months |
The mean PDA in the comparison group ranged from 62.3% to 84.0% | MD 3.03 higher (4.36 lower to 10.43 higher) | ‐ | 1999 (4 RCTs) | ⊕⊝⊝⊝ Very low a, b, c | ||
| LPA Follow‐up: 6 months |
The mean LPA in the comparison group ranged from 0.47 to 1.71 months | MD 0.60 higher (0.30 lower to 1.50 higher) |
‐ | 136 (2 RCTs) | ⊕⊕⊝⊝ Low d, e | No data available for 12‐month follow‐up | |
| Drinking Intensity | DDD Follow‐up: 12 months |
The mean DDD in the comparison group ranged from 4.66 to 5.38 | MD 0.17 lower (1.11 lower to 0.77 higher) | ‐ | 1516 (1 RCT) | ⊕⊕⊕⊝ Moderate c | |
| PDHD Follow‐up: 12 months |
The mean PDHD in the comparison group was 13.4% | MD 5.51 lower (14.15 lower to 3.13 higher) | ‐ | 91 (1 RCT) | ⊕⊕⊝⊝ Low f | ||
| Alcohol‐related consequences (assessed with DrInC) Follow‐up: 12 months |
The mean DrInC in the comparison group ranged from 21.8% to 72.9% | MD 2.88 lower (6.81 lower to 1.04 higher) | ‐ | 1762 (3 RCT) | ⊕⊕⊕⊝ Moderate c | ||
| Alcohol addiction severity
(assessed with ASI) Follow‐up: 12 months |
One study found an advantage for the AA/TSF intervention relative to the comparison intervention in the slope for improvement over a 12‐month follow‐up period (Brooks 2003), as measured by the ASI alcohol composite score (P < 0.05). | 112 (1 quasi‐RCT) | ⊕⊕⊝⊝ Low a, g | ||||
| *The risk in the intervention group (and its 95% confidence interval) is based on the assumed risk in the comparison group and the relative effect of the intervention (and its 95% CI). AA: Alcoholics Anonymous; ASI: Addiction Severity Index; CBT: cognitive behavioral therapy; CI: confidence interval; DDD: drinks per drinking day; DrInC: Drinker Inventory of Consequences; LPA: longest period of abstinence; MD: mean difference; PDA: percentage days abstinent; PDHD: percentage days heavy drinking; RCT: randomized controlled trial; RR: risk ratio; TSF: Twelve‐Step Facilitation | |||||||
| GRADE Working Group grades of evidence High certainty: we are very confident that the true effect lies close to that of the estimate of the effect. Moderate certainty: we are moderately confident in the effect estimate; the true effect is likely to be close to the estimate of the effect, but there is a possibility that it is substantially different. Low certainty: our confidence in the effect estimate is limited; the true effect may be substantially different from the estimate of the effect. Very low certainty: we have very little confidence in the effect estimate; the true effect is likely to be substantially different from the estimate of effect. | |||||||
Quasi‐RCT: studies where due to potential intervention contamination effects within single sites, it was not possible to do parallel, simultaneous randomization, but instead, sequential designs were used where the intervention was implemented and then not implemented and then reimplemented with subsequent groups of participants in an 'ON/OFF' type design.
Manualized: the treatment is based on standardized content delivered in a linear or modular fashion to ensure that the same treatment is delivered across time and different sites where the intervention may be implemented. This ensures that the treatment can be replicated – a key factor in confirming the findings across different studies using the same treatment.
a Downgraded due to study limitations (high risk of selection bias)
b Downgraded two levels due to inconsistency (I2 = 91%)
c Downgraded due to imprecision (CI fails to exclude important benefit or important harm)
d Downgraded due to imprecision (moderate sample size (n = 148))
e Downgraded due to study limitations (potential attrition bias and potential blinding of outcome bias)
f Downgraded due to imprecision (small sample size (n = 91) and wide confidence interval)
g Downgraded as narrative synthesis was conducted, therefore estimates are not precise
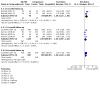
Summary of findings 2. Alcoholics Anonymous (AA)/Twelve‐Step Facilitation (TSF) (non‐manualized) compared to other clinical interventions for alcohol use disorder (1B).
| Alcoholics Anonymous (AA)/Twelve‐Step Facilitation (TSF) (non‐manualized) compared to other clinical interventions for alcohol use disorder (RCT/quasi‐RCT evidence) | |||||||
| Patient or population: adults (> 18 years) with alcohol use disorder, alcohol abuse, or alcohol dependence Setting: outpatient treatment; inpatient/residential facility Intervention: AA/TSF (non‐manualized) Comparison: other clinical interventions (e.g. CBT) | |||||||
| Outcomes | Anticipated absolute effects* (95% CI) | Relative effect (95% CI) | № of participants (studies) | Certainty of the evidence (GRADE) | Comments | ||
| Risk with other clinical interventions | Risk with AA/TSF | ||||||
| Abstinence | Proportion of participants (%) completely abstinent Follow‐up: 9 months |
Study population | RR 1.71 (0.70 to 4.18) |
93 (1 RCT) | ⊕⊕⊝⊝ Lowa | No data available for 12‐month follow‐up | |
| 167 per 1000 | 118 more per 1000 (50 fewer to 530 more) | ||||||
| PDA Follow‐up: 9 months | The mean PDA in the comparison group was 70% | MD 3.00 higher (0.31 higher to 5.69 higher) |
‐ | 93 (1 RCT) |
⊕⊕⊝⊝ Lowa | No data available for 12‐month follow‐up | |
| LPA | None of the studies in this category reported this outcome | ||||||
| Drinking Intensity | DDD Follow‐up: 9 months | The mean DDD in the comparison group was 8.02 | MD 1.76 lower (2.23 lower to 1.29 lower) |
‐ | 93 (1 RCT) | ⊕⊝⊝⊝ Very lowb,c,d | No data available for 12‐month follow‐up |
| PDHD Follow‐up: 12 months |
The mean number of heavy drinking days in the comparison group ranged from 1.44 to 3.89 | MD 2.09 higher (1.24 lower to 5.42 higher) |
‐ | 286 (1 RCT) | ⊕⊕⊝⊝ Lowe,f | ||
| Alcohol‐related consequences | None of the studies in this category reported this outcome | ||||||
| Alcohol addiction severity | None of the studies in this category reported this outcome | ||||||
| *The risk in the intervention group (and its 95% confidence interval) is based on the assumed risk in the comparison group and the relative effect of the intervention (and its 95% CI). AA: Alcoholics Anonymous; CBT: cognitive behavioral therapy; CI: confidence interval; DDD: drinks per drinking day; LPA: longest period of abstinence; MD: mean difference; PDA: percentage days abstinent; PDHD: percentage days heavy drinking; RCT: randomized controlled trial; RR: risk ratio; TSF: Twelve‐Step Facilitation | |||||||
| GRADE Working Group grades of evidence High certainty: we are very confident that the true effect lies close to that of the estimate of the effect. Moderate certainty: we are moderately confident in the effect estimate; the true effect is likely to be close to the estimate of the effect, but there is a possibility that it is substantially different. Low certainty: our confidence in the effect estimate is limited; the true effect may be substantially different from the estimate of the effect. Very low certainty: we have very little confidence in the effect estimate; the true effect is likely to be substantially different from the estimate of effect. | |||||||
Quasi‐RCT: studies where due to potential intervention contamination effects within single sites, it was not possible to do parallel, simultaneous randomization, but instead, sequential designs were used where the intervention was implemented and then not implemented and then reimplemented with subsequent groups of participants in an 'ON/OFF' type design.
Manualized: the treatment is based on standardized content delivered in a linear or modular fashion to ensure that the same treatment is delivered across time and different sites where the intervention may be implemented. This ensures that the treatment can be replicated – a key factor in confirming the findings across different studies using the same treatment.
aDowngraded two levels due to imprecision (small sample size (n = 93)). bDowngraded due to study limitations (risk of attrition bias). cDowngraded due to imprecision (moderate sample size (n = 121)). dDowngraded due to indirectness (the focus on dual diagnosis participants with severe mental illness which may not be the population of interest most associated with AA/TSF). eDowngraded due to imprecision (moderate sample size (n = 286)). fDowngraded due to study limitations (having no information reported to assess four different types of bias).
Summary of findings 3. Alcoholics Anonymous (AA)/Twelve‐Step Facilitation (TSF) (manualized) compared to a different type of TSF for alcohol use disorder (2A).
| Alcoholics Anonymous (AA)/Twelve‐Step Facilitation (TSF) (manualized) compared to a different type of Twelve‐Step Facilitation for alcohol use disorder (RCT/quasi‐RCT evidence) | |||||||
| Patient or population: adults (> 18 years) with alcohol use disorder, alcohol abuse, or alcohol dependence Setting: outpatient treatment; inpatient/residential facility Intervention: AA/TSF (manualized) Comparison: a different type of TSF (i.e. varying in TSF style or intensity) | |||||||
| Outcomes | Anticipated absolute effects* (95% CI) | Relative effect (95% CI) | № of participants (studies) | Certainty of the evidence (GRADE) | Comments | ||
| Risk with different type of TSF | Risk with AA/TSF | ||||||
| Abstinence | Proportion of participants (%) completely abstinent Follow‐up: 12 months |
Study population | RR 1.28 (1.00 to 1.63) |
307 (1 RCT) | ⊕⊕⊕⊝ Moderatea | ||
| 404 per 1000 | 113 more per 1000 (0 fewer to 255 more) | ||||||
| PDA Follow‐up: 12 months |
The mean PDA in the comparison group was 67.41% | MD 16.40 higher (5.12 higher to 27.68 higher) |
‐ | 95 (1 RCT) | ⊕⊕⊕⊝ Moderateb | ||
| LPA | None of the studies in this category reported this outcome | ||||||
| Drinking Intensity | DDD Follow‐up: 6 months |
The mean DDD in the comparison group was 6.7 | MD 4.10 lower (10.44 lower to 2.24 higher) |
‐ | 42 (1 RCT) | ⊕⊕⊕⊝ Moderatec | No data available for 12‐month follow‐up |
| PDHD | None of the studies in this category reported this outcome | ||||||
| Alcohol‐related consequences | None of the studies in this category reported this outcome | ||||||
| Alcohol addiction severity
(assessed with ASI) Follow‐up: 12 months |
The mean ASI in the comparison group was 0.13 | MD 0.08 higher (0.02 higher to 0.15 higher) |
‐ | 307 (1 RCT) |
⊕⊕⊕⊝ Moderateb | ||
| *The risk in the intervention group (and its 95% confidence interval) is based on the assumed risk in the comparison group and the relative effect of the intervention (and its 95% CI). AA: Alcoholics Anonymous; ASI: Addiction Severity Index; CI: confidence interval; DDD: drinks per drinking day; LPA: longest period of abstinence; MD: mean difference; PDA: percentage days abstinent; PDHD: percentage days heavy drinking; RCT: randomized controlled trial; RR: risk ratio; TSF: Twelve‐Step Facilitation | |||||||
| GRADE Working Group grades of evidence High certainty: we are very confident that the true effect lies close to that of the estimate of the effect. Moderate certainty: we are moderately confident in the effect estimate; the true effect is likely to be close to the estimate of the effect, but there is a possibility that it is substantially different. Low certainty: our confidence in the effect estimate is limited; the true effect may be substantially different from the estimate of the effect. Very low certainty: we have very little confidence in the effect estimate; the true effect is likely to be substantially different from the estimate of effect. | |||||||
Quasi‐RCT: studies where due to potential intervention contamination effects within single sites, it was not possible to do parallel, simultaneous randomization, but instead, sequential designs were used where the intervention was implemented and then not implemented and then reimplemented with subsequent groups of participants in an 'ON/OFF' type design.
Manualized: the treatment is based on standardized content delivered in a linear or modular fashion to ensure that the same treatment is delivered across time and different sites where the intervention may be implemented. This ensures that the treatment can be replicated – a key factor in confirming the findings across different studies using the same treatment.
aDowngraded due to imprecision (moderate sample size (n = 307)). bDowngraded due to imprecision (small sample size (n = 95)). cDowngraded due to imprecision (small sample size (n = 48)).
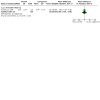
Summary of findings 4. Alcoholics Anonymous (AA)/Twelve‐Step Facilitation (TSF) (non‐manualized) compared to a different type of TSF for alcohol use disorder (2B).
| Alcoholics Anonymous (AA)/Twelve‐Step Facilitation (TSF) (non‐manualized)compared to a different type of TSF for alcohol use disorder (RCT/quasi‐RCT evidence) | |||||||
| Patient or population: adults (> 18 years) with alcohol use disorder, alcohol abuse, or alcohol dependence Setting: outpatient treatment; inpatient/residential facility Intervention: AA/TSF (non‐manualized) Comparison: a different type of TSF (i.e. varying in TSF style or intensity) | |||||||
| Outcomes | Anticipated absolute effects* (95% CI) | Relative effect (95% CI) | № of participants (studies) | Certainty of the evidence (GRADE) | Comments | ||
| Risk with different type of TSF | Risk with AA/TSF | ||||||
| Abstinence | Proportion of participants (%) completely abstinent Follow‐up: 12 months |
Study population | RR 1.15 (1.02 to 1.29) |
382 (1 quasi‐RCT) | ⊕⊕⊕⊝ Moderatea | ||
| 713 per 1000 | 107 more per 1000 (14 more to 207 more) | ||||||
| PDA | None of the studies in this category reported this outcome | ||||||
| LPA | None of the studies in this category reported this outcome | ||||||
| Drinking intensity | DDD | None of the studies in this category reported this outcome | |||||
| PDHD | None of the studies in this category reported this outcome | ||||||
| Alcohol‐related consequences | None of the studies in this category reported this outcome | ||||||
| Alcohol addiction severity | None of the studies in this category reported this outcome | ||||||
| *The risk in the intervention group (and its 95% confidence interval) is based on the assumed risk in the comparison group and the relative effect of the intervention (and its 95% CI). AA: Alcoholics Anonymous; CI: confidence interval; DDD: drinks per drinking day; LPA: longest period of abstinence; PDA: percentage days abstinent; PDHD: percentage days heavy drinking; RCT: randomized controlled trial; RR: risk ratio; TSF: Twelve‐Step Facilitation | |||||||
| GRADE Working Group grades of evidence High certainty: we are very confident that the true effect lies close to that of the estimate of the effect. Moderate certainty: we are moderately confident in the effect estimate; the true effect is likely to be close to the estimate of the effect, but there is a possibility that it is substantially different. Low certainty: our confidence in the effect estimate is limited; the true effect may be substantially different from the estimate of the effect. Very low certainty: we have very little confidence in the effect estimate; the true effect is likely to be substantially different from the estimate of effect. | |||||||
Quasi‐RCT: studies where due to potential intervention contamination effects within single sites, it was not possible to do parallel, simultaneous randomization, but instead, sequential designs were used where the intervention was implemented and then not implemented and then reimplemented with subsequent groups of participants in an 'ON/OFF' type design.
Manualized: the treatment is based on standardized content delivered in a linear or modular fashion to ensure that the same treatment is delivered across time and different sites where the intervention may be implemented. This ensures that the treatment can be replicated – a key factor in confirming the findings across different studies using the same treatment.
aDowngraded due to study limitations (risk of random sequence generation, allocation concealment, and attrition bias).
Summary of findings 5. Alcoholics Anonymous (AA)/Twelve‐Step Facilitation (TSF) (manualized) compared to other clinical interventions for alcohol use disorder: non‐randomized studies (3B).
| Alcoholics Anonymous (AA)/Twelve‐Step Facilitation (TSF) (manualized)compared to other clinical interventions for alcohol use disorder: non‐randomized studies | |||||||
| Patient or population: adults (> 18 years) with alcohol use disorder, alcohol abuse, or alcohol dependence Setting: outpatient treatment; inpatient/residential facility Intervention: AA/TSF (manualized) Comparison: other clinical interventions (e.g. CBT) | |||||||
| Outcomes | Anticipated absolute effects* (95% CI) | Relative effect (95% CI) | № of participants (studies) | Certainty of the evidence (GRADE) | Comments | ||
| Risk with other clinical interventions | Risk with AA/TSF | ||||||
| Abstinence | Proportion of participants (%) completely abstinent Follow‐up: 12 months |
Study population | RR 1.25 (1.09 to 1.43) | 2692 (2 non‐ randomized) | ⊕⊝⊝⊝ Very lowa | ||
| 286 per 1000 | 358 per 1000 (312 to 409) | ||||||
| PDA | None of the studies in this category reported this outcome | ||||||
| LPA | None of the studies in this category reported this outcome | ||||||
| Drinking intensity | DDD Follow‐up: 36 months | The mean DDD in the comparison group was 6.28 | MD 0.00 (3.38 lower to 3.38 higher) |
‐ | 201 (1 non‐ randomized) | ⊕⊝⊝⊝ Very lowb,c | No data available for 12‐month follow‐up |
| PDHD | None of the studies in this category reported this outcome | ||||||
| Alcohol‐related consequences (assessed with SIP) Follow‐up: 12 months |
The mean SIP in the comparison group ranged from 4.1 to 5.3 | MD 0.71 lower (1.68 lower to 0.27 higher) |
‐ | 647 (1 non‐ randomized) |
⊕⊝⊝⊝ Very lowa,b | ||
| Alcohol addiction severity
(assessed with ADS) Follow‐up: 36 months |
The mean ADS in the comparison group was 3.5 | MD 0.30 lower (2.20 lower to 1.60 higher) |
‐ | 201 (1 non‐ randomized) | ⊕⊝⊝⊝ Very lowb,c | No data available for 12‐month follow‐up | |
| *The risk in the intervention group (and its 95% confidence interval) is based on the assumed risk in the comparison group and the relative effect of the intervention (and its 95% CI). AA: Alcoholics Anonymous; ADS: Alcohol Dependence Scale; CI: confidence interval; DDD: drinks per drinking day; LPA: longest period of abstinence; MD: mean difference; PDA: percentage days abstinent; PDHD: percentage days heavy drinking; RCT: randomized controlled trial; RR: risk ratio; SIP: Short Inventory of Problems; TSF: Twelve‐Step Facilitation | |||||||
| GRADE Working Group grades of evidence High certainty: we are very confident that the true effect lies close to that of the estimate of the effect. Moderate certainty: we are moderately confident in the effect estimate; the true effect is likely to be close to the estimate of the effect, but there is a possibility that it is substantially different. Low certainty: our confidence in the effect estimate is limited; the true effect may be substantially different from the estimate of the effect. Very low certainty: we have very little confidence in the effect estimate; the true effect is likely to be substantially different from the estimate of effect. | |||||||
Non‐randomized: prospective, parallel, group design studies in which intact intervention groups receive either an AA/TSF intervention or a comparison intervention without being randomly assigned to interventions.
Manualized: the treatment is based on standardized content delivered in a linear or modular fashion to ensure that the same treatment is delivered across time and different sites where the intervention may be implemented. This ensures that the treatment can be replicated – a key factor in confirming the findings across different studies using the same treatment.
aDowngraded due to study limitations (the lack of control of sample selection and non‐randomized nature). bDowngraded due to indirectness (comparability of cohorts for baseline characteristics and outcome measures, and protection against contamination). cDowngraded due to imprecision (being a single study with a moderate sample size (N = 201)).
Summary of findings 6. Alcoholics Anonymous (AA)/Twelve‐Step Facilitation (TSF) (non‐manualized) compared to a different type of TSF for alcohol use disorder: non‐randomized studies (4B).
| Alcoholics Anonymous (AA)/Twelve‐Step Facilitation (TSF) (non‐manualized)compared to a different type of TSF for alcohol use disorder: non‐randomized studies | |||||||
| Patient or population: adults (> 18 years) with alcohol use disorder, alcohol abuse, or alcohol dependence Setting: inpatient/residential facility Intervention: AA/TSF (non‐manualized) Comparison: a different type of TSF (i.e. varying in TSF style or intensity) | |||||||
| Outcomes | Anticipated absolute effects* (95% CI) | Relative effect (95% CI) | № of participants (studies) | Certainty of the evidence (GRADE) | Comments | ||
| Risk with different type of TSF | Risk with AA/TSF | ||||||
| Abstinence | Proportion of participants (%) completely abstinent Follow‐up: 12 months |
Study population | RR 1.24 (1.05 to 1.46) |
1870 (1 non‐ randomized) |
⊕⊝⊝⊝ Very lowa | ||
| 203 per 1000 | 49 more per 1000 (10 more to 94 more) | ||||||
| PDA Follow‐up: 6 months |
The mean PDA in the comparison group was 92.4% | MD 0.01 lower (7.14 lower to 7.12 higher) |
‐ | 195 (1 non‐randomized) | ⊕⊝⊝⊝ Very lowa,b | No data available for 12‐month follow‐up | |
| LPA | None of the studies in this category reported this outcome | ||||||
| Drinking Intensity | DDD Follow‐up: 6 months | One study (Grant 2018) reported DDD based on n = 25 across both groups who were participants who drank any alcohol during the follow‐up period and found no evidence of a difference between the more (mean 17.63, SD 23.71) and less (mean 11.47, SD 5.94) intensive AA/TSF interventions, P = 0.49. | 195 (1 non‐ randomized) | ⊕⊝⊝⊝ Very lowa,b,c | Data were not pooled because authors reported only those participants that drank any alcohol and not the total proportion of participants that drank. They also did not provide numbers by treatment intervention. No data available for 12‐month follow‐up |
||
| PDHD | None of the studies in this category reported this outcome | ||||||
| Alcohol‐related consequences | None of the studies in this category reported this outcome | ||||||
| Alcohol addiction severity (assessed with ASI‐L) Follow‐up: 6 months |
The mean ASI‐L in the comparison group was 0.16 | MD 0.01 higher (0.05 lower to 0.07 higher) |
‐ | 140 (1 non‐ randomized) | ⊕⊝⊝⊝ Very lowa,b | No data available for 12‐month follow‐up | |
| *The risk in the intervention group (and its 95% confidence interval) is based on the assumed risk in the comparison group and the relative effect of the intervention (and its 95% CI). AA: Alcoholics Anonymous; ASI‐L: Addiction Severity Index‐Lite; CI: confidence interval; DDD: drinks per drinking day; LPA: longest period of abstinence; MD: mean difference; PDA: percentage days abstinent; PDHD: percentage days heavy drinking; RCT: randomized controlled trial; RR: risk ratio; TSF: Twelve‐Step Facilitation | |||||||
| GRADE Working Group grades of evidence High certainty: we are very confident that the true effect lies close to that of the estimate of the effect. Moderate certainty: we are moderately confident in the effect estimate; the true effect is likely to be close to the estimate of the effect, but there is a possibility that it is substantially different. Low certainty: our confidence in the effect estimate is limited; the true effect may be substantially different from the estimate of the effect. Very low certainty: we have very little confidence in the effect estimate; the true effect is likely to be substantially different from the estimate of effect. | |||||||
Non‐randomized: prospective, parallel, group design studies whereby intact intervention groups receive either an AA/TSF intervention or a comparison intervention without being randomly assigned to interventions.
Manualized: the treatment is based on standardized content delivered in a linear or modular fashion to ensure that the same treatment is delivered across time and different sites where the intervention may be implemented. This ensures that the treatment can be replicated – a key factor in confirming the findings across different studies using the same treatment.
aDowngraded due to study limitations (risk of attrition bias). bDowngraded due to imprecision (a single study with a moderate sample size (N = 195)). cDowngraded as narrative synthesis was conducted, therefore estimates are not precise.
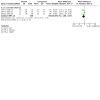
Summary of findings 7. Alcoholics Anonymous (AA)/Twelve‐Step Facilitation (TSF) compared to other clinical interventions and a different type of TSF for alcohol use disorder: cost‐effectiveness studies (5).
| Alcoholics Anonymous (AA)/Twelve‐Step Facilitation (TSF) compared to other clinical interventions and a different type of TSF for alcohol use disorder: cost‐effectiveness studies | |||
| Patient or population: alcohol use disorder Setting: outpatient treatment; inpatient/residential facility Intervention: AA/TSF Comparison: other clinical interventions and a different type of TSF | |||
| Outcomes | № of participants (studies) | Certainty of the evidence (GRADE) | Impact |
| Healthcare cost savings
(assessed with total medical care cost savings) Follow‐up: 6 months to 7 years |
5348 (4 studies) | ⊕⊕⊕⊝ Moderatea | Four studies contributed five separate published reports. In three studies (four study reports), AA/TSF had higher healthcare cost savings than outpatient treatment, CBT, and no AA/TSF treatment. One other study found that total medical care costs decreased for participants attending CBT, MET, and AA/TSF treatment, but that AA/TSF had higher cost‐savings potential compared to MET among participants with worse prognostic characteristics. |
| AA/TSF: Alcoholics Anonymous/Twelve‐Step Facilitation; CBT: cognitive behavioral therapy; MET: motivational enhancement therapy | |||
| GRADE Working Group grades of evidence High certainty: we are very confident that the true effect lies close to that of the estimate of the effect. Moderate certainty: we are moderately confident in the effect estimate; the true effect is likely to be close to the estimate of the effect, but there is a possibility that it is substantially different. Low certainty: our confidence in the effect estimate is limited; the true effect may be substantially different from the estimate of the effect. Very low certainty: we have very little confidence in the effect estimate; the true effect is likely to be substantially different from the estimate of effect. | |||
aDowngraded due to random sequence generation bias, and problems with comparability of cohorts at baseline; protection against contamination between study interventions.
Background
Description of the condition
Alcohol use disorder (AUD) confers a prodigious burden of disease, disability, and premature mortality, particularly in middle‐ and high‐income countries (Stahre 2014). With 3.3 million attributable deaths each year globally, alcohol is responsible for approximately 10 times the mortality rate for all illicit drugs combined, as well as 5.1% of the total global burden of disease (WHO 2014). Alcohol misuse is the leading risk factor for death and disability among 15‐ to 59‐year‐olds worldwide (WHO 2014) and, on average, moderate‐to‐severe AUD shortens lifespan by 20 to 30 years (Rosenbaum 2015). The financial burden associated with alcohol misuse is also enormous ‐ amounting to approximately USD 250 billion annually in the USA alone due to lost productivity, crime and incarceration, and increased healthcare utilization (Sacks 2015). The response to these problems is multipronged, and includes a broad array of specific professional treatment services in diverse settings. In addition, a number of low‐cost or free recovery support services have emerged to prevent relapse and aid recovery (e.g. mutual‐help organizations, sober living environments) (White 2012). Alcohol‐focused recovery mutual‐help organizations include Blue Cross (Austria), Vie Libre (France), Danshuakai (Japan), Abstainer's Clubs (Poland), and the Links (Sweden) (Humphreys 2004). The oldest and by far the largest of these AUD recovery supports is Alcoholics Anonymous (AA).
Description of the intervention
AA consists of several million members in 181 countries (Humphreys 2004), and is a worldwide, nonprofessional, peer‐to‐peer support organization intended to help those suffering from AUD to achieve abstinence from alcohol and increase quality of life (Alcoholics Anonymous 2001). In many world regions, AA is widely accessed. In North America, for example, it is the most commonly sought source of help for AUD (Caetano 1998; Hedden 2015; Room 2006). Although it was originally an all‐male and white organization, AA now attracts a diverse membership of women and men from a wide range of racial and ethnic backgrounds (Hoffman 2009; Humphreys 1994; Jilek‐Aall 1981; OSG 2018). As such, AA is part of the de facto system of care for AUD. Given that AUD is highly prevalent worldwide, especially in middle‐ and high‐income countries, and is susceptible to relapse and reinstatement over the long term, the free and widespread availability of AA gives the organization potential to serve large numbers of people for extended periods. AA holds meetings in local community, rented accommodation (e.g. churches/synagogues, hospitals, community centers, colleges). Group meetings typically last 60 to 90 minutes, during which members share personal narratives of their alcohol addiction and recovery experiences, and help one another practice the principles encompassed in a 12‐step program that is intended to increase psychological well‐being, improve interpersonal skills, enhance the ability to cope with stress, and facilitate adaptation to abstinence and a sober lifestyle (Kelly 2009a). The widespread adoption of AA and its influence on the professional treatment industry in some countries has spurred increasing efforts to evaluate its clinical and public health impact.
In addition to peer‐led AA mutual‐help groups, researchers have also evaluated clinical interventions that have adapted the methodology and concepts of AA. These Twelve‐Step Facilitation (TSF) interventions include extended counseling, adopting some of the techniques and principles of AA, as well as brief interventions designed to link individuals to community AA groups (Humphreys 1999). These interventions vary in session length, format, and duration of treatment. For example, TSF interventions can consist of a single session lasting a few minutes to multiple, hour‐long sessions delivered over several months (see Table 8). TSF interventions can also be delivered clinically in individual or group sessions. The goal of TSF interventions is to engage people with AUD with AA during and, importantly, post treatment, to sustain remission over time. TSF interventions have been studied to determine whether they succeed at linking individuals with AA, and whether this, in turn, results in better alcohol‐related and other outcomes (Ducharme 2006; Kelly 2013a; Kelly 2017a; Knudsen 2016; Longabaugh 1998; Litt 2007; Mann 2006a; Mann 2006b; Walitzer 2009; Walitzer 2015). In this review, we use the abbreviation 'AA/TSF' to refer to these 12‐step programs and AA interventions in order to reflect both types of 12‐step effects of interest.
1. Follow‐up time points, treatment duration and treatment setting.
| Study | Follow‐up time period (months) | Treatment duration | Setting |
| Blondell 2001 | 6 | A single session of either a peer intervention (30‐60 minutes), brief intervention (5‐15 minutes), or usual care (60 minutes) | Inpatient/ residential facility |
| Blondell 2011 | 3 |
TAU: 3 to 5 calendar days treatment
TSF: TAU + single 45‐ to 60‐minute session of TSF MET: TAU + single 45‐ to 60‐minute session of MET |
Inpatient/ residential facility |
| Bogenschutz 2014 | 9 |
TSF: TAU + 12 weekly sessions of TSF therapy TAU: TAU in the clinical dual diagnosis program |
Outpatient |
| Bowen 2014 | 12 | 8 weeks of either MBRP (1 weekly 2‐hour session), RP (1 weekly 2‐hour session), or TAU (1‐2 sessions/week for 1.5 hours) |
Outpatient |
| Brooks 2003 | 12 | Both treatment groups met for 5 hours per day, 5 days per week over a 6‐month course of treatment | Outpatient |
| Brown 2002 | 6 | TSF: 10 weekly 90‐minute 12‐step aftercare group sessions RP: 10 weekly 90‐minute relapse prevention aftercare group sessions UC: non‐specific support groups that encourage participants to maintain their substance use goals and include discussion of problems and potential solutions | Outpatient |
| Davis 2002 | 6 | 6 months of either MT (1 weekly session during which participants viewed an alcoholism education movie, with a post‐film discussion held once per month) or ST (3‐week orientation period consisting of 6 group therapy sessions, 3 alcohol education sessions during which alcohol education films were shown, 3 community meetings and a minimum of 6 AA meetings, followed by weekly group and/or individual therapy sessions for the remainder of the treatment period, and optional alcohol education sessions beyond the orientation period) | Outpatient |
| Grant 2018 | 6 |
RAIR: standard treatment + rural‐adapted intensive referral (3 sessions) SR: standard treatment and referral |
Inpatient/ residential facility |
| Herman 2000 | 18 | STW: treatment in the standard short‐term treatment ward only (average length of stay = 31.1 days; staff not trained in substance use treatment) MHCD program: treatment provided by mental health staff trained in substance use treatment and included educational lectures, AA and/or NA groups (participants required to attend at least 2 meetings per week), gender‐specific support groups, and family education sessions (average length of stay = 51.4 days) | Inpatient/ residential facility |
| Holder 2000 | 36 | 12 weeks of either TSF/CBT with weekly treatment sessions, or MET with four sessions that occurred during weeks 1, 2, 6, and 12 | Outpatient |
| Humphreys 1996 | 36 | Continuous assessment of community‐based AA participation during the follow‐up period (i.e. 36 months) | See footnote* |
| Humphreys 2001 | 12 | 21 to 28 days | Inpatient/ residential facility |
| Humphreys 2007 | 24 | 21 to 28 days | Inpatient/ residential facility |
| Kahler 2004 | 6 | ME‐12: one 60‐minute session BA: one 5‐minute session Both interventions also included daily sessions with a psychiatrist, daily AA/NA meetings, and one group session per day (range of program stay = 2 to 8 days (mean 4.6, SD 1.6)) | Inpatient/ residential facility |
| Kaskutas 2009b | 12 |
MAAEZ: six 90‐minute MAAEZ sessions replaced six usual care 12‐step education groups
TAU: usual care groups only (mean length of program stay was 112 days (SD 80) for long‐term residents, 33 days (SD 32) for short‐term residents, 44 days (SD 42) for outpatients) |
Outpatient, inpatient/ residential facility |
| Kelly 2017b | 6 | 10 weekly sessions: iTSF consisted of one 60‐ to 75‐minute individual session, one 30‐ to 50‐minute individual session, and eight 90‐minute group sessions; MET/CBT consisted of two 60‐minute individual MET sessions and eight 90‐minute group CBT sessions | Outpatient |
| Litt 2007 | 12 & 24 | 12 weeks (weekly 60‐minute sessions) | Outpatient |
| Litt 2016 | 24 | 12 weeks (weekly 60‐minute sessions) | Outpatient |
| Lydecker 2010 | 12 | 24 weeks. Both interventions consisted of two consecutive phases of treatment. Phase I included bi‐weekly hour‐long group sessions and monthly individual medication management visits. Phase II included weekly hour‐long group sessions and monthly medication management. | Outpatient |
| Manning 2012 | 3 |
PI: one 30‐ to 45‐minute session DI: one 30‐ to 45‐minute session NI: participants provided with a list of meetings only |
Inpatient/ residential facility |
| MATCH 1997 | 12, 36 & EOT | 12 weeks: TSF/CBT consisted of weekly treatment sessions; MET consisted of four sessions that occurred during weeks 1, 2, 6, and 12 | Outpatient |
| McCrady 1996 | 6, 18 & EOT | 15 weeks (weekly 90‐minute sessions) | Outpatient |
| Mundt 2012 | 60 | Continuous assessment of community‐based AA participation during the follow‐up period (i.e. 60 months) | Outpatient |
| Ouimette 1997 | 12 | 21 to 28 days | Inpatient/ residential facility |
| Timko 2006 | 6 & 12 | 3 sessions of either IR or SR across the course of 1 month | Outpatient |
| Timko 2011 | 6 | IR: standard outpatient mental health care + four additional outpatient group sessions within one month SR: standard outpatient mental health care during which counselors gave participants a schedule of local dual‐focused 12‐step meetings | Outpatient |
| Vederhus 2014 | 6 | MI: two weekly, 30‐minute education sessions + standard detox BA: brief advice to attend 12‐step groups in participants' home communities + standard detox (days on the ward averaged 12.6 days (SD 6.5) in the MI group and 9.9 days (SD 3.2) in the BA group) | Inpatient/ residential facility |
| Walitzer 2009 | 12 | 11 x 60‐minute sessions and one 90‐minute session over the course of 12 weeks | Outpatient |
| Walitzer 2015 | 6 | 12 x 60‐minute sessions over the course of 12 weeks | Outpatient |
| Zemore 2018 | 12 | Continuous assessment of community‐based AA participation during the follow‐up period (i.e. 12 months) | Outpatient |
*This study consisted of participants recruited from inpatient/residential facilities as well as those seeking treatment through an information and referral helpline (Humphreys 1996), and were naturalistically followed.
AA: Alcoholics Anonymous BA: brief advice CBT: cognitive behavioral therapy DI: doctor intervention EOT: end of treatment IR: intensive referral iTSF: integrated 12‐Step Facilitation MAAEZ: Making AA Easier ME‐12: extended motivational enhancement MET: motivational enhancement therapy MBRP: mindfulness‐based relapse prevention MHCD: Mental Health Chemical Dependence MI: motivational intervention MT: minimal treatment NA: Narcotics Anonymous NI: no intervention PI: peer intervention RAIR: rural‐adapted intensive referral RP: relapse prevention SD: standard deviation SR: standard referral ST: standard outpatient treatment STW: standard short‐term treatment ward TAU: treatment as usual TSF: Twelve‐Step Facilitation UC: usual care
How the intervention might work
The original AA intervention is purported to work via its social fellowship and 12‐step program (Alcoholics Anonymous 2001). The social components operate through peer support and role modeling of successful AUD recovery, and through providing close mentoring and recovery management oversight through 'sponsorship'. The common suffering of AA group members may provide a sense of belonging or universality that can help to diminish negative affect, particularly shame, loneliness and guilt, which is similar to some forms of group psychotherapy (Yalom 2008). Furthermore, the observation of others who are sustaining recovery in AA can instill much‐needed hope for a better future. AA also provides an arena for members to learn, and model, effective communication and coping skills, as well as specific strategies for abstaining from alcohol. Members are encouraged to obtain a 'sponsor' ‐ a recovery mentor well‐established in sobriety ‐ who can offer guidance, daily support, and accountability to help new members stay sober. The 12‐step program is intended to facilitate the internal psychological, emotional, and spiritual changes deemed necessary to sustain abstinence and lead to enhanced psychological well‐being and improved relationships that can compete with the more immediate rewards provided by alcohol use (Alcoholics Anonymous 2001; Kelly 2013b). AA has an ostensibly 'spiritual' basis, which some members consider central to the program, and which may underlie the altruistic behavior that can help promote recovery (Zemore 2004). Yet many members do not consider the spiritual aspects of the program central (Alcoholics Anonymous 2018; Humphreys 2004). Rigorous reviews of the mechanisms of behavior change through which AA enhances recovery have found that AA typically confers benefits by mobilizing multiple therapeutic factors simultaneously ‐ mostly through facilitating adaptive changes in the social networks of participants, but also by boosting members’ recovery coping skills, recovery motivation, abstinence self‐efficacy, and psychological well‐being, and by reducing impulsivity and craving (Kelly 2009b; Kelly 2017a).
It is likely that TSF interventions have quite similar change mechanisms, as they have been adapted directly from AA interventions, but, as they are of short duration and AUD is typically chronic, any long‐term impact of TSF would be due less to the intervention itself than to its ability to connect an individual to long‐term participation in AA.
Why it is important to do this review
AA is not controlled or standardized by professionals, so historically it has been harder to study than professionally‐designed and delivered treatments for which manuals are written, doses can be randomly assigned, and length of contact can be standardized and predetermined (Humphreys 2004; Kelly 2013a). However, AA researchers have become increasingly sophisticated at finding methods to rigorously evaluate AA, including in randomized clinical trials. Reviews of this research have been conducted, including a prior Cochrane Review (Ferri 2006a; Ferri 2006b; Kaskutas 2009a; Kelly 2009b), but a flurry of additional empirical investigations since these reviews were conducted signifies a need for a major update. Consequently, an additional rigorous, high‐quality systematic review is needed that includes more recent studies to provide information about the clinical and public health utility, effectiveness, and cost‐effectiveness of AA and TSF. This review updates and supercedes the previously conducted Cochrane Review (Ferri 2006b).
Objectives
To evaluate whether peer‐led AA and professionally‐delivered treatments that facilitate AA involvement (Twelve‐Step Facilitation (TSF) interventions) achieve important outcomes, specifically: abstinence, reduced drinking intensity, reduced alcohol‐related consequences, alcohol addiction severity, and healthcare cost offsets.
Methods
Criteria for considering studies for this review
Types of studies
We included studies that compared AA or TSF with other interventions, such as motivational enhancement therapy (MET) or cognitive behavioral therapy (CBT), 12‐step program variants, or no treatment.
We included the following study designs:
randomized controlled trials (RCTs);
quasi‐RCTs (i.e. studies where due to potential contamination of intervention effects within single sites, it was not possible to do parallel, simultaneous randomization, but instead, sequential designs were used, where either random blocks were assigned to one intervention followed by the other; or where the intervention was implemented, then not implemented, and then reimplemented with subsequent random groups of participants in an 'on/off' type design); and
non‐randomized studies (i.e. prospective, parallel, group design studies, with intact intervention groups that received either an Alcoholics Anonymous/Twelve‐Step Facilitation (AA/TSF) intervention or a comparison intervention without random assignment).
Given the potential healthcare cost savings of people using freely available community‐based mutual‐help groups such as AA ( either spontaneously or in response to receiving a TSF/12‐step treatment) we considered any type of economic study that examined formal healthcare cost offsets in relation to these interventions (e.g. cost‐effectiveness, cost utility, cost‐benefit analyses). Despite the fairly large number of RCTs and quasi‐RCTs available, we included non‐randomized comparative designs in order to compare and contrast results from these studies with the more scientifically rigorous RCT designs.
Types of participants
We included male and female adults (18 years or older) with alcohol use disorder (AUD), alcohol abuse, or alcohol dependence, as defined using standardized criteria (i.e. the Diagnostic and Statistical Manual of Mental Disorders, 4th and 5th editions (APA 1994; APA 2013); the 9th and 10th revisions of the International Statistical Classification of Diseases and Related Health Problems (WHO 2010); and validated screening or diagnostic tools). We excluded studies that involved participants who had been coerced to attend AA meetings (e.g. by court order, employer, etc.).
Types of interventions
In this review, AA participation and TSFs were compared with at least one of the following interventions.
Other theoretically distinct clinical interventions (e.g. motivational enhancement therapy (MET), cognitive‐behavioral therapies (CBT), etc.).
Other 12‐step program variants (e.g. studies comparing different types of 12‐step interventions that varied in style of intensity).
No treatment (e.g. wait‐list control).
'Treatment as usual' (TAU) was used in several studies to refer to a variety of psychosocial interventions delivered in individual and group formats that pertained to aspects of psychoeducation around addiction, relapse prevention skills building, and linking to recovery‐specific social support. For a more detailed description of each intervention, please see the Characteristics of included studies.
Types of outcome measures
We examined four primary outcomes and two secondary outcomes across the included studies.
Primary outcomes
-
Abstinence, measured as:
proportion of individuals who are continuously abstinent.
longest period of abstinence (LPA)
percentage days abstinent (PDA)
-
Drinking intensity, measured as:
drinks consumed per drinking day (DDD)
percentage days of heavy drinking (PDHD)
grams of pure alcohol consumed
Alcohol‐related consequences, measured as: self‐reports of physical, social, and psychological sequelae resulting from alcohol use (e.g. Drinker Inventory of Consequences (DRINC) (Miller 1995), Short Inventory of Problems (SIP) (Miller 1995), or similar measures)
Alcohol addiction severity, measured by: the Addiction Severity Index (ASI; McLellan 1980); or similar measures.
These outcomes were measured through self‐report and, when available and appropriate, confirmed via bioassay.
Secondary outcomes
-
Healthcare cost offsets, measured as:
changes in addiction
mental health‐related service utilization
related monetary impacts
Indices reflecting quality of life and/or psychological well‐being
Search methods for identification of studies
Electronic searches
We imposed no language, publication year or publication status restrictions. We identified published, unpublished, and ongoing studies by searching the following databases from their inception.
Cochrane Drugs and Alcohol Group Specialised Register (CDAG) Specialised Register (inception to 2 August 2019).
Cochrane Central Register of Controlled Trials (CENTRAL) (inception to 2 August 2019).
MEDLINE PubMed (from 1946 to 2 August 2019).
Embase Ovid (from 1974 to 2 August 2019).
CINAHL EBSCO (Cumulative Index to Nursing and Allied Health Literature; from 1982 to 2 August 2019).
PsycINFO EBSCO (from 1935 to 2 August 2019).
We modeled the subject strategies for databases on the search strategy designed for CENTRAL (Appendix 1).
We searched the following trial registries.
World Health Organization International Clinical Trials Registry Platform (www.who.int/trialsearch) (15 November 2018).
ClinicalTrials.gov (www.clinicaltrials.gov) (15 November 2018).
We also searched the above databases for health economics evidence.
Searching other resources
We attempted to identify other potentially eligible studies by searching the reference lists of retrieved included studies, systematic reviews, and meta‐analyses. We discovered five additional articles through these methods and through handsearching.
Data collection and analysis
Selection of studies
Two review authors (JK and KH) independently scanned the abstract, title, or both, of every record retrieved to determine which studies should be evaluated further for inclusion. We retrieved all potentially relevant articles as full text, and resolved any discrepancies between the two review authors through consultation and discussion with the third review author (MF). When a potential study for inclusion that had been conducted by one of the review authors was detected, the study reports were screened independently by one of the other authors of this review who was not associated with that study. After discussion among the authors, we added studies that remained questionable for review inclusion to the list of articles awaiting assessment. We contacted study authors for clarification when necessary. We delineated the study selection process in a PRISMA flow chart (Liberati 2009; Moher 2009).
Data extraction and management
Using a standardized data extraction form, two review authors (JK and KH) independently abstracted the relevant elements of the study, including study design, sample characteristics, description of the experimental and control interventions, outcomes, study funding, and conflicts of interest. Any disagreements regarding these details were resolved among all review authors by discussion. We contacted study authors for clarification when necessary.
Assessment of risk of bias in included studies
Two review authors (KH and MF) independently assessed the risk of bias in the included studies using the criteria recommended in the Cochrane Handbook for Systematic Reviews of Interventions (Higgins 2011a). When included reports had been authored by one of the authors of this review (e.g. Humphreys 1996), the risk of bias was rated by the other two review authors to prevent conflicts of interest and potential bias. The recommended Cochrane approach for assessing risk of bias in studies comprises the assessment of seven domains:
sequence generation;
allocation concealment (selection bias);
blinding of participants and personnel;
blinding of outcome assessors (detection bias);
incomplete outcome data (attrition bias);
selective outcome reporting (reporting bias); and
-
other sources of bias including:
comparability of cohorts for baseline characteristics and outcome measures on the basis of the design or analysis;
selection of the non‐exposed cohort; and
protection against cross‐contamination of the intervention.
The first part of the assessment process involved describing what was reported to have happened in the study. The second part involved assigning a judgment relating to the risk of bias for that entry, in terms of low, high, or unclear risk. To make these judgments, we used the criteria indicated in the Cochrane Handbook for Systematic Reviews of Interventions (Higgins 2011b), adapted to the addiction field (see Appendix 2 for details).
We addressed the domains of sequence generation and allocation concealment (avoidance of selection bias) using a single entry for each study.
Blinding of participants and personnel (performance bias) was not possible given that the focus of this review was on psychosocial interventions. In fact, knowledge of participation in a psychosocial intervention is part of the therapeutic effect; therefore, we think that lack of blinding of participants and personnel does not introduce bias. For this reason, we judged all studies as being at low risk of performance bias.
We had planned initially to assess blinding of outcome assessor separately for objective and subjective outcomes, but all the outcomes reported in the included studies were subjective (self‐reported data), even though many of these were supported by objective biological assay (e.g. urine toxicology screens).
We provided a separate rating of bias for economic studies so that they could be rated independently from the clinical outcome analysis. This was done because, even though they came from the same study, the analytic method for each type of analysis is very different. Also, one study was purely an economic study and did not contribute data to the estimate of AA/TSF effects because it did not have a true comparison group (Mundt 2012).
We considered incomplete outcome data (while also taking due note of any observed attrition bias) for all outcomes.
We operationalized 'Risk of bias' tables to be used for the assessment of RCTs, quasi‐RCTs, and prospective observational studies that included a comparison intervention, according to the criteria recommended by Cochrane Drugs and Alcohol (see Appendix 2 for details).
We evaluated any economic studies using the appropriate Cochrane 'Risk of bias' criteria, along two dimensions, as specified in the Cochrane Handbook for Systematic Reviews of Interventions (section 15.5.2; Shemilt 2011a). This included two types of bias ratings:
assessment of the risk of bias in results of the effectiveness study on which the full economic evaluation study is based, informed by a recognized checklist for effectiveness studies; and
assessment of the methodological quality of the full economic evaluation study, informed by a recognized checklist for economic evaluations conducted alongside single study designs.
As recommended by Cochrane (Shemilt 2011a), we utilized the Evers checklist for rating the certainty of economic studies in the current review (Evers 2005; Appendix 3).
Measures of treatment effect
We calculated the standardized mean difference (SMD) for continuous variables (e.g. percentage days abstinent (PDA)), or the relative risk (i.e. risk ratios (RRs)) for dichotomous variables (e.g. proportion of participants completely abstinent), with the uncertainty of the estimate expressed using 95% confidence intervals (CIs). We pooled and analyzed study effects wherever possible using meta‐analyses. We used random‐effects estimates to account for potential heterogeneity among studied interventions in the included studies. We described any remaining studies in table format and described results in the narrative. These are referred to below in the Results section as Analysis 1.1, Analysis 2.3, and Analysis 6.3, and appear in the 'Data and Analyses' section tables as 'Other Data'.
1.1. Analysis.
Comparison 1: 1A Grouping: RCT/quasi‐RCT, all treatments manualized, compared to different theoretical orientation, Outcome 1: Proportion completely abstinent
2.3. Analysis.
Comparison 2: 1B Grouping: RCT/quasi‐RCT, 1 + treatments non‐manualized, compared to different theoretical orientation, Outcome 3: Percentage days abstinent (PDA)
| Percentage days abstinent (PDA) | |
| Study | Result |
| Herman 2000 | Using a log transformed days of drinking variable, this study found a slight advantage at 2‐months post‐treatment (P = 0.03) that favored the AA/TSF condition relative to the comparison condition, but between two and 18 months post‐treatment, there was no evidence of a difference on average between the two groups (P = 0.05). The treatment by time interaction was not reported. |
6.3. Analysis.
Comparison 6: 4B: Non‐randomized, 1+ treatments non‐manualized, compared to TSF variant, Outcome 3: Drinks per drinking day (DDD)
| Drinks per drinking day (DDD) | |
| Study | Result |
| Grant 2018 | This study reported drinks per drinking day (DDD) only for those participants (n = 25) who were not abstinent during the follow‐up period and found no difference in DDD between the Rural Adapted Intensive Referral (mean 17.63, SD 23.71) and the standard referral (mean 11.47, SD 5.94), P = 0.49. |
Unit of analysis issues
In order to avoid double‐counting (i.e. unit of analysis errors that can inflate statistical significance) (Higgins 2011b), and analyze studies properly where there was one AA/TSF intervention group compared to two or more comparison groups, we split the population of the AA/TSF intervention group in the meta‐analyses, based on the guidelines outlined in the Cochrane Handbook for Systematic Reviews of Interventions (How to include multiple groups from one study) (Higgins 2011b). This method was preferred over the two alternative methods: averaging the effects of the comparison interventions, or conducting completely separate analyses by distinct type of comparison intervention. This is because, firstly, averaging effects of different comparison interventions artificially assumes these interventions are conceptually similar and confer similar benefit; and secondly, there are insufficient numbers of the same comparison intervention to justify separate analyses by comparison group type.
Dealing with missing data
We appraised the presence and impact of missing data on study findings. We detailed this in the narrative as appropriate. We also detailed in a table how the included studies handled missing data. When necessary, we contacted the original study authors to attempt to obtain missing data and information of their potential impact.
Assessment of heterogeneity
Given the potential high level of heterogeneity across experimental treatments and comparison treatments, we conducted a quantitative aggregation (meta‐analysis) that included statistical estimation of the degree of heterogeneity calculated using the Q value and I2statistic.
Assessment of reporting biases
We planned to use visual inspection of funnel plots (plots of the effect estimate from each study against the sample size or effect standard error) to indicate possible publication bias if there were at least 10 studies included in the meta‐analysis. We did not inspect funnel plots because there were always less than 10 studies in any given meta‐analysis (Sterne 2011).
Data synthesis
Wherever possible, we conducted pooled analysis and aggregation of data using a random‐effects model, because we expected a certain degree of heterogeneity among trials. This was possible for the proportion of participants completely abstinent, PDA, DDD, and PDHD. We analyzed the five observational, prospective, non‐randomized studies we included separately (see Analysis 5.1, Analysis 5.2, Analysis 5.3, Analysis 5.4, Analysis 5.5, Analysis 6.1, Analysis 6.2, Analysis 6.3 and Analysis 6.4).
5.1. Analysis.
Comparison 5: 3B: Non‐randomized, 1+ treatments non‐manualized, compared to different theoretical orientation, Outcome 1: Proportion of participants completely abstinent
5.2. Analysis.
Comparison 5: 3B: Non‐randomized, 1+ treatments non‐manualized, compared to different theoretical orientation, Outcome 2: Drinks per drinking day (DDD)
5.3. Analysis.
Comparison 5: 3B: Non‐randomized, 1+ treatments non‐manualized, compared to different theoretical orientation, Outcome 3: Alcohol‐related consequences (SIP)
5.4. Analysis.
Comparison 5: 3B: Non‐randomized, 1+ treatments non‐manualized, compared to different theoretical orientation, Outcome 4: Alcohol‐related consequences
5.5. Analysis.

Comparison 5: 3B: Non‐randomized, 1+ treatments non‐manualized, compared to different theoretical orientation, Outcome 5: Alcohol addiction severity (Alcohol Dependence Scale)
6.1. Analysis.
Comparison 6: 4B: Non‐randomized, 1+ treatments non‐manualized, compared to TSF variant, Outcome 1: Proportion completely abstinent
6.2. Analysis.
Comparison 6: 4B: Non‐randomized, 1+ treatments non‐manualized, compared to TSF variant, Outcome 2: Percentage days abstinent (PDA)
6.4. Analysis.
Comparison 6: 4B: Non‐randomized, 1+ treatments non‐manualized, compared to TSF variant, Outcome 4: Addition Severity Index‐Lite (ASI‐L)
As detailed in the Cochrane Handbook for Systematic Reviews of Interventions (section 15.6.3) (Shemilt 2011a), there is currently no consensus regarding appropriate methods for pooling combined estimates of cost‐effectiveness studies, in addition, there are potential issues concerning the validity of such methods when combining metrics across cost‐effectiveness studies. For these reasons, rather than conduct a meta‐analysis, we summarized results from any cost‐effectiveness studies in the narrative.
Subgroup analysis and investigation of heterogeneity
We describe subgroup analyses according to AUD severity, where appropriate (e.g. according to the DSM IV criteria 'abuse' versus 'dependence'; APA 1994).
Sensitivity analysis
We conducted sensitivity analyses by examining studies across three major dimensions:
type of study design (e.g. RCT/quasi‐RCT, non‐randomized);
degree of manualization and verified clinical fidelity in implementation of the intervention (e.g. documentation of regular audio/video‐taped clinical supervision to monitor adherence to the treatment manual and measurement of clinical competence in its delivery); and
the type of intervention to which AA/TSF was compared (e.g. an intervention based on a different theory, such as cognitive behavioral therapy (CBT), or an intervention based on the same type of TSF‐orientation but that varied in TSF style of intensity).
Grading of evidence
We assessed the overall certainty of evidence for the primary outcomes using the GRADE system (GRADEpro GDT 2015; Schunemann 2013), which takes into account issues related to internal and external validity, such as risk of bias, directness, consistency, precision of results, and publication bias. These ratings were based on studies that had the 12‐month assessment outcome time point. If there was no 12‐month outcome within a particular subgrouping for a given outcome, then GRADE ratings were based on the next closest outcome time point from the evidence available. We used GRADEpro GDT to create the 'Summary of findings' tables (GRADEpro GDT 2015). These tables present the main findings of the review in a transparent and simple tabular format. Outcomes are presented where possible for 12‐month follow‐ups,and key information concerning the certainty of evidence, the magnitude of effect of the interventions, and the sum of available data for the main outcomes is also shown.
The GRADE system uses the following criteria for assigning grades of evidence.
High certainty: we are very confident that the true effect lies close to that of the estimate of the effect.
Moderate certainty: we are moderately confident in the effect estimate; the true effect is likely to be close to the estimate of the effect, but there is a possibility that it is substantially different.
Low certainty: our confidence in the effect estimate is limited; the true effect may be substantially different from the estimate of the effect.
Very low certainty: we have very little confidence in the effect estimate; the true effect is likely to be substantially different from the estimate of effect.
Grading can be decreased for any of the following reasons.
Serious (‐1 grade) or very serious (‐2) study limitation for risk of bias.
Serious (‐1) or very serious (‐2) inconsistency between study results.
Some (‐1) or major (‐2) uncertainty about directness (the correspondence between the population, the intervention, or the outcomes measured in the studies actually found and those under consideration in our systematic review).
Serious (‐1) or very serious (‐2) imprecision of the pooled estimate.
Publication bias strongly suspected.
By default, according to the Cochrane system for grading evidence, all non‐randomized studies are automatically rated as 'low certainty', and then downgraded from there based on any of the above‐listed reasons. Evidence from non‐randomized studies can be upgraded for large effects, specifically, evidence of dose response and confounding which would be expected to result in an effect opposite to that observed.
Results
Description of studies
We included 27 primary studies with a total of 10,565 participants. Twenty‐six of these primary studies contributed data to the estimate of the effectiveness of Alcoholics Anonymous/Twelve‐Step Facilitation (AA/TSF). Twenty‐one of these 27 studies were randomized controlled trials (RCTs)/quasi‐RCTs; five were non‐randomized studies, and one study was used for purely economic purposes (Mundt 2012), and did not contribute to the estimate of the effectiveness of AA/TSF, because it did not include a comparison intervention. Three other studies also included economic analyses (classified as cost‐benefit studies; e.g. see Drummond 2005; Shemilt 2011a), making a total of four included economic studies reported across five included papers.
Results of the search
Electronic searches yielded 12,733 articles from the databases specified in Electronic searches. We identified an additional five studies through author correspondence, and three through clinical trial records, making a total of 12,741 articles. After duplicates were removed, 5808 records remained. We removed 5758 of these after screening titles and abstracts, as they were irrelevant to the current study. This left a total of 50 full‐text reports, which we examined in detail. We excluded 13 of these because they did not meet the inclusion criteria (documented in Figure 1; see also Characteristics of excluded studies). This left a total of 37 published study reports relating to the 27 primary studies that met our inclusion criteria.
1.

PRISMA study flow diagram.
Included studies
Most studies were conducted in the USA, with one study from the UK (Manning 2012), and one from Norway (Vederhus 2014). Details of characteristics and bias ratings for each study are included in the Characteristics of included studies. Where there were two or more papers describing different follow‐up time points for a given study, we combined the papers describing the results of the different time points under that study.
Although all of the study populations were extremely likely to have had various proportions of participants meeting clinical criteria for other psychiatric disorders (e.g. major depression, anxiety disorders etc.) in addition to alcohol use disorder (AUD), these proportions were rarely explicitly documented. There were four studies, however, that met the inclusion criteria that did explicitly document the degree of psychiatric comorbidity (Bogenschutz 2014; Brooks 2003; Herman 2000; Timko 2011). Although, such dually‐diagnosed samples are sometimes reviewed separately (e.g. Tonigan 2018), we included these studies here because they otherwise met our inclusion criteria. When we performed sensitivity analyses, we did not find differences in the overall pattern of findings when we included or excluded these studies.
The Characteristics of included studies tables also include two additional ratings for each study as follows.
Grading criteria for study adherence/competence rating:
0 = non‐manualized (i.e. treatments were unlikely to be replicable), or no report of attempts to ensure adherence/competence of intervention implementation;
1 = report of attempts to ensure adherence/competence without audio or videotape;
2 = report of attempts to ensure adherence/competence with audio or videotape monitoring and rating.
Manualization and non‐manualization of study interventions:
M = manualized: treatments were replicable because they followed a session‐to‐session outline of procedures
NM = non‐manualized: treatments were unlikely to be replicable
Study design
We included a total of 27 primary studies (21 RCTs/quasi‐RCTs, 5 non‐randomized, and 1 purely economic study) that reported follow‐up results across a total of 36 reports.
Participants
The total number of participants across the 27 included studies was 10,565, including 2456 participants who contributed to the economic analyses.
The average sample age ranged from 34.2 years old in Brooks 2003 to 51.0 years old in Timko 2011;
The proportion of female participants ranged from 0% in Ouimette 1997 and McCrady 1996 to 49.1% in Humphreys 1996.
The racial composition varied from 7.3% non‐white participants in Litt 2016 to 54% in Ouimette 1997.
In the economic evaluations, the average sample age ranged from 16.1 years old at baseline in Mundt 2012 to 43 years old in Ouimette 1997; from 0% female in Ouimette 1997 to 49.1% female in Humphreys 1996; and from 8% non‐white participants in MATCH 1997 to 76.9% in Herman 2000.
Types of comparisons
Experimental interventions included AA participation and TSF. Comparison interventions included other psychological clinical interventions (e.g. motivational enhancement therapy (MET), cognitive behavioral therapy (CBT), etc.), other 12‐step program variants (e.g. studies comparing different styles/intensities of 12‐step interventions), and no treatment (e.g. wait‐list control). However, we identified no included studies that contained a no treatment/wait‐list comparison group. Interventions and comparisons varied by degree of therapy manualization, duration/number of treatment sessions, whether they were clinician or peer‐led, in a clinical or community setting, and in clinical population focus.
There were three broad dimensions that characterized these included studies: the type of study used; the degree of treatment manualization (signifying the degree of intervention standardization and replicability); and the types of treatments to which AA/TSF was compared (see Figure 2 and Figure 3 (the latter includes the number of participants in each of these subcategories)).
2.
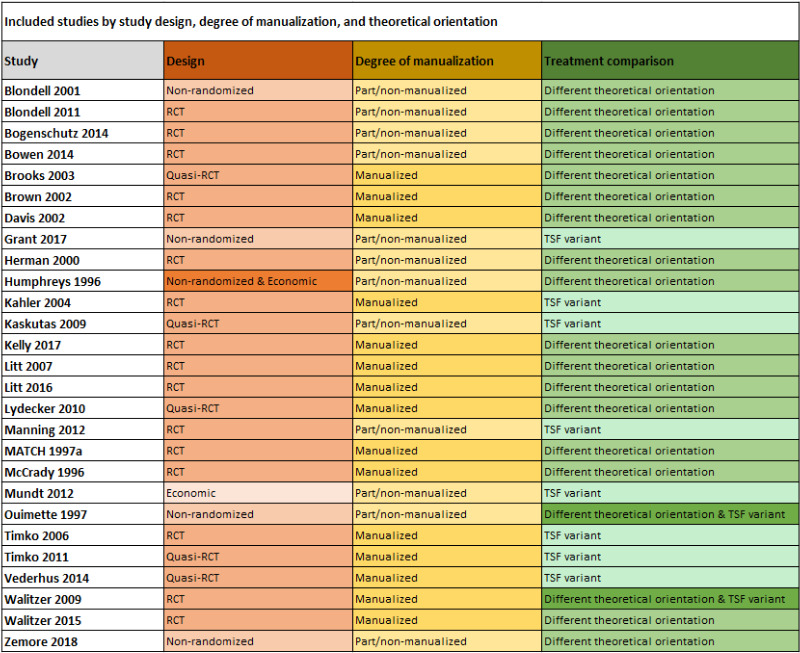
Manualized = the treatment covers standardized content in a linear or modular fashion to ensure that the same treatment is delivered across time and different sites where the intervention may be implemented. This ensures that the treatment can be replicated – a key factor in confirming the findings across different studies using the same treatment.
3.
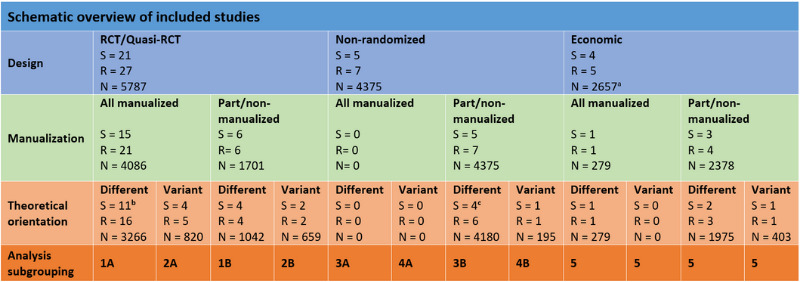
S = number of studies from Cochrane Review
R = number of reports from Cochrane Review
N = number of participants in the cell subcategory
Manualized = the treatment covers standardized content in a linear or modular fashion to ensure that the same treatment is delivered across time and different sites where the intervention may be implemented. This ensures that the treatment can be replicated – a key factor in confirming the findings across different studies using the same treatment.
aThe total Ns added across study types will not add to 10,565 because some of the participants that are in the other groupings (e.g. non‐randomized designs) are also in the economic category. bWalitzer 2009 and its participants are included in both the 1A and 2A grouping in the review, but for the purposes of this table, the study and its participants (n = 169) are only counted once in the 1A group. cOuimette 1997 and its participants are included in both the 3B and 4B grouping, but for the purposes of this table, the study and its participants (n = 3018) are only counted in the 3B group.
Within design types, studies varied in whether treatments were manualized or non‐manualized, and whether they compared AA/TSF to a different theoretical orientation (e.g. CBT), or to a different type of TSF (i.e. one that varied in TSF style or intensity). Among the 21 RCT/quasi‐RCT designs (5787 participants; 28 reports), 15 studies were manualized (10 compared AA/TSF to a different theoretical orientation; 4 compared AA/TSF variants, 1 compared AA/TSF to both another theoretical orientation and an AA/TSF variant); 4 studies had one or more non‐manualized interventions (2 compared AA/TSF to a different theoretical orientation, 2 compared AA/TSF variants); two studies were non‐manualized (both compared AA/TSF to a different theoretical orientation). Among the five studies that were non‐randomized (4375 participants; 7 reports), two studies had at least one intervention non‐manualized (1 compared AA/TSF to a different theoretical orientation and 1 compared AA/TSF to an AA/TSF variant); three studies had treatments that were all non‐manualized (2 compared AA/TSF to a different theoretical orientation and 1 compared AA/TSF to a different theoretical orientation as well as an AA/TSF variant). Together, 26 primary studies contributed data to the estimate of the effectiveness of AA/TSF. We utilized the final included study purely for its economic analysis (Mundt 2012; 403 participants); this study did not contribute to the estimate of the effectiveness of AA/TSF, because it did not include a comparison intervention.
Keeping these dimensions in mind, below we have reported the findings from the included studies in five summary categories with subcategories as follows.
1a: studies that employed a RCT/quasi‐RCT design with all treatments manualized and compared AA/TSF to a treatment with a different theoretical orientation (e.g. CBT) (11 studies).
1b: studies that employed a RCT/quasi‐RCT design where at least one comparison treatment was non‐manualized and AA/TSF was compared to a treatment with a different theoretical orientation (e.g. CBT) (4 studies).
2a: studies that employed a RCT/quasi‐RCT design with all treatments manualized and AA/TSF was compared to a different type of TSF (i.e. varying in TSF style or intensity) (5 studies).
2b: studies that employed a RCT/quasi‐RCT design where at least one comparison treatment was non‐manualized and AA/TSF was compared to a different type of TSF (i.e. varying in TSF style or intensity) (2 studies).
3a: studies that employed a non‐randomized design with all treatments manualized and where AA/TSF was compared to a different theoretical orientation (e.g. CBT) (note: there are no studies included in this category).
3b: studies that employed a non‐randomized design with at least one non‐manualized treatment intervention and where AA/TSF was compared to a different theoretical treatment orientation (e.g. CBT) (4 studies).
4a: studies that employed a non‐randomized design with all treatments manualized and where AA/TSF was compared to a different type of TSF (i.e. varying in style or intensity) (note: there are no studies included in this category).
4b: studies that employed a non‐randomized design with at least one non‐manualized treatment intervention and where AA/TSF was compared to a different TSF variant (i.e. in varying in TSF style or intensity) (2 studies).
5: economic studies (e.g. healthcare cost offset) (4 studies).
Length of follow‐up
Follow‐up length ranged from the end of treatment through to five years (Table 8). For the economic studies, follow‐up length ranged from one year to seven years.
Outcomes assessed in the studies
We examined our four primary outcomes and two secondary outcomes across the included studies. The primary outcomes assessed in the studies were as follows.
-
Abstinence, measured as:
proportion of individuals who are continuously abstinent (17 studies; 23 reports);
longest period of abstinence (LPA) (2 studies; 2 reports); and
percentage days abstinent (PDA) (16 studies; 21 reports).
-
Drinking intensity, measured as:
drinks consumed per drinking day (DDD) (9 studies; 11 reports ‐ note: 1 study was based on grams of pure alcohol consumed, converted into USA standard drinks per drinking day);
percentage days of heavy drinking (PDHD) (4 studies; 4 reports).
Alcohol‐related consequences, measured as: self‐reports of physical, social, and psychological sequelae resulting from alcohol use (e.g. Drinker Inventory of Consequences (DRINC; Miller 1995), Short Inventory of Problems (SIP; Miller 1995), or similar measures; 8 studies; 10 reports).
Alcohol addiction severity (7 studies; 8 reports), measured by: the Addiction Severity Index (ASI; McLellan 1980) (6 studies; 7 reports), Alcohol Dependence Scale (ADS; 1 study; 1 report).
Secondary outcomes assessed in the studies consisted of the economic analyses (4 studies; 5 reports) measured by cost‐benefit analysis (see Characteristics of included studies tables for specific examples). In some instances either the means or standard deviations (SDs), or both, were missing from the published reports. On each occasion, we were able to obtain these directly from the study authors through personal correspondence (i.e. Kahler 2004; Litt 2007; Litt 2016; MATCH 1997; Walitzer 2009). None of the included studies reported indices reflecting quality of life or psychological well‐being.
Thirteen studies included a bioassay (either a breathalyzer, blood, urinalysis, saliva, or a combination of these), while 13 did not report the use of one; the final study was an economic analysis only, for which use of a bioassay was not appropriate. The included studies were conducted prior to the introduction of biological assays such as ethyl glucuronide (EtG) and phosphatidylethanol (PetH), both of which can detect alcohol for much longer than the assays used in the studies. Since, at that time, there was a limited window for detecting alcohol use using breathalyzers and urinalysis bioassay, use of bioassays to corroborate self‐report was less common than it is now. Regardless, it is unlikely that any systematic bias would occur across comparison treatment interventions because all participants were subjected to the same procedures and protocols.
Funding sources
Included studies were funded through grants from one or more of the following sources: the United States National Institutes of Health (18 studies); the USA Department of Veterans Affairs (8 studies); and through various other organizations (e.g. private foundations, (academic) or institutions; 8 studies). For two studies researchers did not report their funding source (Davis 2002; Kahler 2004).
Excluded studies
We excluded 24 studies from the review because they did not meet the inclusion criteria in terms of: study design (13 studies), interventions evaluated (3 studies), participants (6 studies), study design plus intervention (1 study), or study design plus outcomes (1 study).
Risk of bias in included studies
As noted in Assessment of risk of bias in included studies, we rated all reports across seven risk of bias dimensions using the standard Cochrane 'Risk of bias' ratings criteria (see Appendix 2; Figure 4; Figure 5). These criteria apply to risk of bias ratings for randomized as well as for observational, prospective, studies. In the latter case, random sequence generation and allocation concealment are automatically rated as 'high risk'; we awarded such ratings in this review (i.e. for the 5 included observational, prospective studies). In future updates of this review, if we include a larger number of observational, prospective studies, then it may also be prudent to conduct a separate 'Risk of bias' rating specifically designed for evaluating risks in such studies, for example ROBINS‐I (Sterne 2016).
4.
Risk of bias graph: review authors' judgments about each risk of bias item presented as percentages across all included studies.
5.
Risk of bias summary: review authors' judgments about each risk of bias item for each included study.
Note: 27 primary studies
Allocation
For random sequence generation, we rated 11 of the 27 primary studies as potentially high risk for selection bias because they either used alternation as a non‐random component in the sequence generation process (6 studies) or were non‐randomized (5 studies). We rated half of the studies (13 studies) as low risk, and three studies as being at unclear risk of bias. For allocation concealment, we rated 13 studies as low risk and three as unclear risk. We rated 11 studies as high risk of selection bias because they were either non‐randomized (6 studies) or researchers who were enrolling participants could possibly foresee assignment to treatment interventions (5 studies).
Blinding
For detection bias we rated 22 studies as being at unclear risk because insufficient information was provided to enable us to make a judgement of high or low risk, four studies as low risk, and one study as high risk because there was no blinding of outcome assessments. For the economic analyses (4 studies; 5 reports), we rated three studies as being at unclear risk of bias (Humphreys 1996; Mundt 2012; MATCH 1997), and one study as low risk (Ouimette 1997).
We rated blinding of participants and personnel (performance bias) as high in six studies, low in five studies, and unclear in 15 studies.
Incomplete outcome data
We rated attrition bias as unclear in approximately half of the studies (14 studies) and low in four studies. In nine studies, we rated attrition bias as high risk because the studies had moderate (≥ 20%) attrition rates (8 studies), or there was a significant difference in attrition rates in the intervention groups (1 study).
Of the 27 included studies, 12 did not report how they handled missing data; 5 used intention‐to‐treat analyses (with worst case scenario); and the remaining 10 studies used a variety of procedures to impute or compensate for any missing data (see Table 9).
2. How studies handled any missing data.
| Study | Missing data |
| Blondell 2001 | Procedures for accounting for missing data were not reported. |
| Blondell 2011 | Procedures for accounting for missing data were not reported. |
| Bogenschutz 2014 | Missing data were reconstructed by participant self‐report when participants returned for later follow‐up assessments. |
| Bowen 2014 | Intention‐to‐treat analyses conducted using sample size weighted orthogonal contrasts and parameters estimated using maximum likelihood estimation, which provides the estimated variance‐covariance matrix for the available data. |
| Brooks 2003 | Hierarchical linear modeling used to analyze change over time in the whole sample and to test for treatment intervention differences on the outcome variables. Hierarchical linear modeling allows for the inclusion of cases with incomplete data, weighting cases with more complete data and reliable trajectories more heavily. |
| Brown 2002 | Procedures for accounting for missing data were not reported. |
| Davis 2002 | Procedures for accounting for missing data were not reported. |
| Grant 2018 | Procedures for accounting for missing data were not reported. |
| Herman 2000 | Procedures for accounting for missing data were not reported. |
| Holder 2000 | Providers, hospitals and insurance companies were contacted to provide cost and utilization data for all patient contacts in order to collect data that may have otherwise been unreported by participants via self‐report. |
| Humphreys 1996 | Intention‐to‐treat analyses were conducted with worst case scenarios attributed to participants who were lost to follow‐up. |
| Humphreys 2001 | No missing data (healthcare utilization data extracted from Veterans Affair's centralized database) |
| Humphreys 2007 | No missing data (Veterans Affairs healthcare data available for all participants) |
| Kahler 2004 | Only participants who provided outcome data for at least two‐thirds of follow‐up (i.e. 4 months) were included in the analyses. |
| Kaskutas 2009b | Intention‐to‐treat analyses were conducted with worst case scenarios attributed to participants who were lost to follow‐up. |
| Kelly 2017b | Intention‐to‐treat analyses were conducted with worst case scenarios attributed to participants who were lost to follow‐up. |
| Litt 2007 | Intention‐to‐treat analyses were conducted with worst case scenarios attributed to participants who were lost to follow‐up. Participants who had missing data were excluded from the analyses. |
| Litt 2016 | Generalized estimating equations were used to maximize use of all available data. |
| Lydecker 2010 | To compensate for missing observations and variation in covariate values, comparisons of outcome summary data were made with adjusted means. |
| Manning 2012 | Procedures for accounting for missing data were not reported. |
| MATCH 1997 | Participants who missed a follow‐up assessment were asked at the next assessment period to provide data regarding their alcohol consumption for the previous period. Participants for whom more than 4 of the 12 months of drinking outcome data were missing were excluded from latent growth analyses. |
| McCrady 1996 | Procedures for accounting for missing data were not reported. |
| Mundt 2012 | Data was analyzed for the 403 participants who completed at least 1 follow‐up interview. |
| Ouimette 1997 | Procedures for accounting for missing data were not reported. |
| Timko 2006 | Procedures for accounting for missing data were not reported. |
| Timko 2011 | Procedures for accounting for missing data were not reported. |
| Vederhus 2014 | Procedures for accounting for missing data were not reported. |
| Walitzer 2009 | Missing data imputed using the expectation maximization algorithm in Statistical Package for the Social Sciences and cases were only included if participants had completed at least one post‐treatment Timeline Followback. |
| Walitzer 2015 | Mixed effects models were used to accommodate for missing data with maximum likelihood estimation. |
| Zemore 2018 | Preliminary and main analyses were conducted using cases with outcome data at 6 and/or 12 months and data on all model covariates. |
Selective reporting
There was no evidence of selective reporting bias of outcomes in any of the reviewed studies; thus, we rated all 27 studies as low risk for reporting bias.
Other potential sources of bias
There is a possibility of inadvertent contamination of 12‐step effects because comparison interventions, while not explicitly facilitating AA participation, cannot realistically prevent participants from attending AA, and it is almost inevitable that some participants will elect to attend AA while in a comparison group (e.g. participants assigned to a CBT comparison may choose to go to AA of their own accord). Because AA participation predicts improved outcomes (Humphreys 2014), this may diminish any potential between‐intervention effects. Between‐intervention estimates in this review are thus conservative estimates of the effectiveness of AA/TSF.
Effects of interventions
See: Table 1; Table 2; Table 3; Table 4; Table 5; Table 6; Table 7
1a Studies that employed a RCT/quasi‐RCT design with all treatments manualized and compared AA/TSF to a treatment with a different theoretical orientation (e.g. CBT)
We included 11 studies reported in 16 articles in this study grouping (Brooks 2003; Brown 2002; Davis 2002; Kelly 2017b; Litt 2007; Litt 2016; Lydecker 2010; MATCH 1997; McCrady 1996; Walitzer 2009; Walitzer 2015). See Table 1 for a summary of the results for our main outcomes and certainty of evidence for each result.
Abstinence
Proportion of participants completely abstinent (continuous abstinence)
Six studies with 2367 participants contributed data to this outcome (Davis 2002; Kelly 2017b; Litt 2007; Litt 2016; MATCH 1997; McCrady 1996).
There was no evidence of a difference for AA/TSF at the end of treatment on this outcome (risk ratio (RR) 1.07, 95% confidence interval (CI) 0.92 to 1.25; P = 0.37; 1 study, 1726 participants), but there were advantages for AA/TSF at all of the other follow‐up time points (Analysis 1.1):
6 months: RR 1.66, 95% CI 1.09 to 2.54; P = 0.02; 3 studies, 238 participants;
12 months: RR 1.21, 95% CI 1.03 to 1.42; P = 0.02; 2 studies, 1936 participants;
24 months: RR 1.37, 95% CI 1.04 to 1.82; P = 0.03; 2 studies, 403 participants;
36 months: RR 1.42, 95% CI 1.17 to 1.73; P = 0.00; 1 study, 952 participants.
Formal tests of between‐study heterogeneity indicated low probability of potential heterogeneity ranging from Tau2= 0.00, P = 0.98; I2 = 0% at the six‐month follow‐up to Tau2= 0.01, P = 0.16; I2 = 37% at the 12‐month follow‐up, suggesting consistency across reported findings.
The GRADE certainty rating for this evidence was high.
Percentage days abstinent
Nine studies, with 2818 participants, assessed this outcome (Davis 2002; Kelly 2017b; Litt 2007; Litt 2016; Lydecker 2010; MATCH 1997; McCrady 1996; Walitzer 2009; Walitzer 2015), but we were only able to meta‐analyze data from eight of them.
AA/TSF showed a small to moderate advantage for this outcome, but only at the 24‐month (mean difference (MD) 12.91, 95% CI 7.55 to 18.27; P < 0.001; 2 studies, 302 participants); and 36‐month (MD 6.64, 95% CI 1.54 to 11.75; P = 0.01; 1 study, 806 participants) time points (Analysis 1.2). There was no evidence of a difference between AA/TSF and comparison interventions at the remaining time points:
1.2. Analysis.
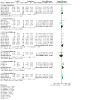
Comparison 1: 1A Grouping: RCT/quasi‐RCT, all treatments manualized, compared to different theoretical orientation, Outcome 2: Percentage days abstinent (PDA)
end of treatment: MD 1.91, 95% CI ‐1.42 to 5.24; P = 0.26; 1 study, 1586 participants;
6 months: MD ‐1.21, 95% CI ‐10.82 to 8.41; P = 0.54; 3 studies, 191 participants;
12 months MD 3.03, 95% CI ‐4.36 to 10.43; P = 0.42; 4 studies, 1999 participants;
18 months MD ‐8.89, 95% CI ‐30.65 to 12.87; P = 0.38; 1 study; 58 participants.
Formal tests of between‐study heterogeneity across points found high heterogeneity at the 12‐month follow‐up (Tau2= 100.00, P < 0.001P < 0.00001; I2 = 91%), but otherwise heterogeneity was very low:
6 months (Tau2 = 0.00, P = 0.54; I2 = 0%);
18 months (Tau2 = 0.00, P = 0.86; I2 = 0%);
24 months (Tau2 = 0.00, P = 0.38; I2 = 0%);
36 months (Tau2 = 0.00, P = 0.56; I2 = 0%).
We excluded one study (Davis 2002), and another study report examining end of treatment outcome (McCrady 1996), from the meta‐analysis because they reported the proportion of days of alcohol use and we were unable to calculate the standard deviation. However, we were able to include the two follow‐up reports at six and 18 months for McCrady 1996 (Analysis 1.2).
Also, because Walitzer 2009 compared two types of AA/TSF interventions (the 12‐step more intensive and prescriptive directive approach to facilitating AA (DIR) and the 12‐step less intensive, client‐centered, motivational enhancement approach to facilitating AA (MOT)) to standard cognitive behavioral therapy (the study authors referred to this as 'treatment as usual' (TAU), but it was a manualized CBT intervention), we included the comparison between DIR and TAU in this section (because this comparison is comparing an AA/TSF intervention with a different theoretical orientation, i.e. CBT) and in section 2a below, we compare DIR to MOT.
The GRADE certainty rating for this evidence was very low; we downgraded due to study limitations, inconsistency and imprecision.
Longest period of abstinence
Two studies with a total of 136 participants provided data for this outcome (Davis 2002; Kelly 2017b). There was no clear difference between AA/TSF and comparison interventions at 6‐month follow‐up (MD 0.60, 95% CI ‐0.30 to 1.50; P = 0.19; 2 studies, 136 participants; very low certainty evidence; Analysis 1.3). Measurements of heterogeneity were moderate to substantial: Tau2= 0.28, P = 0.12; I2 = 60%.
1.3. Analysis.
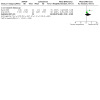
Comparison 1: 1A Grouping: RCT/quasi‐RCT, all treatments manualized, compared to different theoretical orientation, Outcome 3: Longest period of abstinence (LPA, months)
The GRADE certainty rating for this evidence was low; we downgraded due to study limitations, and imprecision.
Drinking intensity
Drinks per drinking day (DDD)
Five studies, with 2295 participants, assessed this outcome (Litt 2007; Litt 2016; MATCH 1997; McCrady 1996; Walitzer 2015).
AA/TSF showed a small advantage on this outcome at the 36‐month follow‐up only (MD ‐1.02, 95% CI ‐1.83 to ‐0.21; 1 study, 806 participants; P = 0.01; Analysis 1.4). Formal tests of between‐study heterogeneity for each time point found no evidence of heterogeneity between study groups, and ranged from very low (at the end of treatment, 24‐month, and 36‐month follow‐ups) to moderate at the 12‐month follow‐up (Tau2 = 0.29, P = 0.22, I2 = 32%).
1.4. Analysis.
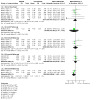
Comparison 1: 1A Grouping: RCT/quasi‐RCT, all treatments manualized, compared to different theoretical orientation, Outcome 4: Drinks per drinking day (DDD)
The GRADE certainty rating for this evidence was moderate; we downgraded due to study imprecision.
Percentage days heavy drinking (PDHD)
Three studies, with 452 participants, assessed this outcome: (Litt 2016; McCrady 1996; Walitzer 2009). We found no difference between treatment interventions at any time point (Analysis 1.5). Formal tests of between‐study heterogeneity were only conducted at the 6‐month follow‐up time point (Tau2= 0.00, P = 0.79, I2 = 0%). The other time points only had one study each that contributed data, and so we did not conduct any formal tests for heterogeneity.
1.5. Analysis.
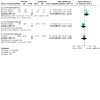
Comparison 1: 1A Grouping: RCT/quasi‐RCT, all treatments manualized, compared to different theoretical orientation, Outcome 5: Percentage days heavy drinking (PDHD)
The GRADE certainty rating for the evidence at 12 month follow‐up was low; we downgraded two levels due to imprecision and wide confidence interval.
Alcohol‐related consequences
In terms of alcohol‐related consequences, six studies with 2433 participants (Kelly 2017b; Litt 2007; Litt 2016; MATCH 1997; Walitzer 2009; Walitzer 2015), and two additional reports (Litt 2007; MATCH 1997), reported this outcome. Six of these studies used the same standardized metric, the Drinker Inventory of Consequences (DRINC), and thus, could be compared using meta‐analysis. There were no differences on this measure at any point (Analysis 1.6). Formal tests of between‐study heterogeneity for each time point found no evidence of heterogeneity between study groups.
1.6. Analysis.
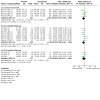
Comparison 1: 1A Grouping: RCT/quasi‐RCT, all treatments manualized, compared to different theoretical orientation, Outcome 6: Alcohol‐related consequences (DrInC)
Walitzer 2015 used the Short Inventory of Problems (SIP), and found no evidence of a difference between the AA/TSF and the anger management comparison intervention at the six‐month follow‐up (MD 0.71, 95% CI ‐4.51 to 5.93; P = 0.79; 1 study, 76 participants; Analysis 1.7). Kelly 2017b used the SIP Second Edition, Revised (SIP‐2R)), and found a benefit in favor of AA/TSF compared to MET/CBT at the six‐month follow‐up (MD ‐0.10, 95% CI ‐0.43 to 0.23; 1 study, 59 participants; P = 0.01; Analysis 1.8).
1.7. Analysis.
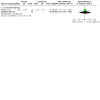
Comparison 1: 1A Grouping: RCT/quasi‐RCT, all treatments manualized, compared to different theoretical orientation, Outcome 7: Alcohol‐related consequences (SIP)
1.8. Analysis.

Comparison 1: 1A Grouping: RCT/quasi‐RCT, all treatments manualized, compared to different theoretical orientation, Outcome 8: Alcohol‐related consequences (SIP‐2R)
The GRADE certainty rating for this evidence was moderate; we downgraded due to study imprecision.
Alcohol addiction severity
Two studies with 448 participants reported this outcome (Brooks 2003; Brown 2002). Brown 2002 found a difference on the Alcohol Severity Index (ASI) alcohol composite score between the AA/TSF and comparison interventions that favored AA/TSF (MD ‐0.05, 95% CI ‐0.09 to ‐0.01; P = 0.02; 1 study, 336 participants; Analysis 1.9). Brooks 2003 found an advantage for AA/TSF over the Self‐Management and Recovery Training (SMART) intervention in the slope for improvement over a 12‐month follow‐up period (Analysis 1.10), as measured by the ASI alcohol composite score (P < 0.05).
1.9. Analysis.

Comparison 1: 1A Grouping: RCT/quasi‐RCT, all treatments manualized, compared to different theoretical orientation, Outcome 9: Addiction Severity Index (ASI)
1.10. Analysis.
Comparison 1: 1A Grouping: RCT/quasi‐RCT, all treatments manualized, compared to different theoretical orientation, Outcome 10: Addiction Severity Index (ASI)
| Addiction Severity Index (ASI) | |
| Study | Result |
| Brooks 2003 | This study found an advantage for the AA/TSF condition over the SMART Recovery condition in the slope for improvement over a 12‐month follow‐up period, as measured by the ASI alcohol composite score (P < 0.05). |
The GRADE certainty rating for this evidence was low; we downgraded due to study limitations and because a narrative synthesis was conducted and therefore estimates are not precise.
Indices reflecting quality of life or psychological well‐being, or both
None of the studies in this category reported this outcome.
1b Studies that employed a RCT/quasi‐RCT design where at least one comparison treatment was non‐manualized and AA/TSF was compared to a treatment with a different theoretical orientation (e.g. CBT)
We included four studies in this category (Blondell 2011; Bogenschutz 2014; Bowen 2014; Herman 2000). See Table 2 for a summary of the results for our main outcomes and certainty of evidence for each result.
Abstinence
Proportion of participants completely abstinent
Two studies with 271 participants reported this outcome (Blondell 2011; Bogenschutz 2014). Blondell 2011 found no difference between AA/TSF and the comparison intervention at the three‐month follow‐up (RR 1.18, 95% CI 0.80 to 1.73; P = 0.41; 1 study, 126 participants; Analysis 2.1). Similarly, at the nine‐month follow‐up, Bogenschutz 2014 observed no difference between interventions (RR 1.71, 95% CI 0.70 to 4.18; P = 0.24; 1 study, 93 participants).
2.1. Analysis.

Comparison 2: 1B Grouping: RCT/quasi‐RCT, 1 + treatments non‐manualized, compared to different theoretical orientation, Outcome 1: Proportion completely abstinent
The GRADE certainty rating for this evidence was low; we downgraded two levels due to small sample size.
Percentage days abstinent (PDA)
Three studies reported this outcome (Blondell 2011; Bogenschutz 2014; Herman 2000), with two observing no difference between the AA/TSF and comparison interventions. Blondell 2011 found no difference between AA/TSF and the comparison at the three‐month follow‐up (MD ‐3.94, 95% CI ‐14.73 to 6.85; P = 0.47; 1 study, 125 participants; Analysis 2.2). At the nine‐month follow‐up, untransformed data from Bogenschutz 2014 showed a higher PDA for AA/TSF than the comparison (MD 3.00, 95% CI 0.31 to 5.69; P = 0.03; 1 study, 93 participants).
2.2. Analysis.
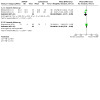
Comparison 2: 1B Grouping: RCT/quasi‐RCT, 1 + treatments non‐manualized, compared to different theoretical orientation, Outcome 2: Percentage days abstinent (PDA)
Using a log‐transformed days of drinking variable, Herman 2000 found a slight advantage at two‐months post‐treatment (P = 0.03) that favored AA/TSF relative to the comparison (Analysis 2.3), but between two and 18 months post‐treatment, there was no evidence of a difference between the two groups (P = 0.05). The treatment by time interaction was not reported.
The GRADE certainty rating for this evidence was low; we downgraded two levels due to small sample size.
Longest period of abstinence
None of the studies in this category reported this outcome.
Drinking intensity
Bogenschutz 2014, using the untransformed measure of drinks per drinking day (DDD), found an advantage for AA/TSF compared to the comparison at the nine‐month follow‐up (MD ‐1.76, 95% CI ‐2.23 to ‐1.29; P < 0.001;1 study, 93 participants; Analysis 2.4).
2.4. Analysis.
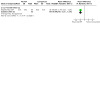
Comparison 2: 1B Grouping: RCT/quasi‐RCT, 1 + treatments non‐manualized, compared to different theoretical orientation, Outcome 4: Drinks per drinking day (DDD)
The GRADE certainty rating for this evidence was very low; we downgraded due to study limitations (risk of attrition bias); imprecision (moderate sample size); and indirectness (the focus was on dual diagnosis participants with severe mental illness, which may not be the population of interest most often associated with AA/TSF).
Bowen 2014 reported heavy drinking days in the past 90 days, and found no difference between treatments (MD 2.09, 95% CI ‐1.24 to 5.42; P = 0.22; 1 study, 286 participants; Analysis 2.5).
2.5. Analysis.
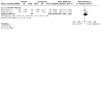
Comparison 2: 1B Grouping: RCT/quasi‐RCT, 1 + treatments non‐manualized, compared to different theoretical orientation, Outcome 5: Percentage days heavy drinking (PDHD)
The GRADE certainty rating for this evidence was low; we downgraded due to imprecision (moderate sample size) and due to study limitations (having no reported information to assess four different types of bias).
Alcohol‐related consequences
None of the studies in this category reported this outcome.
Alcohol addiction severity
None of the studies in this category reported this outcome.
Indices reflecting quality of life or psychological well‐being, or both
None of the studies in this category reported this outcome.
2a Studies that employed a RCT/quasi‐RCT design with all treatments manualized and AA/TSF was compared to a different type of TSF (i.e. varying in TSF style or intensity)
We included five studies reported in six papers in this category (Kahler 2004; Timko 2006; Timko 2011; Vederhus 2014; Walitzer 2009). See Table 3 for a summary of the results for our main outcomes and certainty of evidence for each result.
Abstinence
Proportion of participants completely abstinent
Three studies with 772 participants reported the proportion of participants completely abstinent (Timko 2006; Timko 2011; Vederhus 2014). There were no differences at the six‐month follow‐up (RR 1.07, 95% CI 0.96 to 1.18; P = 0.23; 3 studies, 772 participants; Analysis 3.1), or the 12‐month follow‐up (RR 1.28, 95% CI 1.00 to 1.63; P = 0.05; 1 study, 307 participants; Analysis 3.1). We conducted formal tests of between‐study heterogeneity only for the six‐month follow‐up, for which there was a low probability of heterogeneity (Tau2 = 0.00, P = 0.55; I2 = 0%). We did not test for heterogeneity at the 12‐month follow‐up, as only one study contributed data to that time point.
3.1. Analysis.
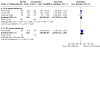
Comparison 3: 2A Grouping: RCT/quasi‐RCT, all treatments manualized, compared to TSF variant, Outcome 1: Proportion of participants completely abstinent
The GRADE certainty rating for this evidence was moderate; we downgraded due to imprecision (moderate to small sample).
Percentage days abstinent (PDA)
Two studies reported data for PDA (Kahler 2004; Walitzer 2009). Kahler 2004 found no difference in PDA at the six‐month follow‐up (MD ‐5.50, 95% CI ‐25.35 to 14.35; P = 0.59; 1 study, 42 participants; Analysis 3.2), and Walitzer 2009 found an advantage for AA/TSF compared to the comparison at 12‐month follow‐up (MD 16.40, 95% CI 5.12 to 27.68; P = 0.004; 1 study, 95 participants; Analysis 3.2).
3.2. Analysis.
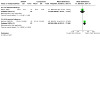
Comparison 3: 2A Grouping: RCT/quasi‐RCT, all treatments manualized, compared to TSF variant, Outcome 2: Percentage days abstinent (PDA)
Two studies reported on days of alcohol use at the six‐month follow‐up (Timko 2011; Vederhus 2014), and found no difference between the more and less intensive AA/TSF interventions studied (MD ‐1.93, 95% CI ‐4.55 to 0.69; P = 0.15; 2 studies, 427 participants; Analysis 3.3).
3.3. Analysis.
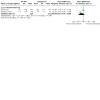
Comparison 3: 2A Grouping: RCT/quasi‐RCT, all treatments manualized, compared to TSF variant, Outcome 3: Days of use (PDA)
The GRADE certainty rating for this evidence was moderate; we downgraded due to imprecision (small sample).
Longest period of abstinence
None of the studies in this category reported this outcome.
Drinking intensity
Kahler 2004 found no difference between interventions for drinks per drinking day (DDD) (MD ‐4.10, 95% CI ‐10.44 to 2.24; P = 0.21; 1 study, 42 participants; Analysis 3.4).
3.4. Analysis.
Comparison 3: 2A Grouping: RCT/quasi‐RCT, all treatments manualized, compared to TSF variant, Outcome 4: Drinks per drinking day (DDD)
The GRADE certainty rating for this evidence was moderate; we downgraded due to imprecision (small sample).
Alcohol‐related consequences
None of the studies in this category reported this outcome.
Alcohol addiction severity
Two studies reported in three papers reported alcohol addiction severity using the ASI (Timko 2006; Timko 2011). There was no difference between the more and less intensive AA/TSF interventions at the six‐month follow‐up (MD 0.03, 95% CI ‐0.07 to 0.13; P = 0.53; 2 studies, 690 participants; Analysis 3.5), but there was an advantage for the more intensive AA/TSF intervention at the 12‐month follow‐up (MD 0.08, 95% CI 0.02 to 0.15; P = 0.01; 1 study, 307 participants; Analysis 3.5).
3.5. Analysis.
Comparison 3: 2A Grouping: RCT/quasi‐RCT, all treatments manualized, compared to TSF variant, Outcome 5: Addiction Severity Index (ASI)
Vederhus 2014 assessed alcohol addiction severity using the European version of the ASI (EuropASI). Using the raw means and SDs from the study, showed an advantage for the more intensive AA/TSF intervention compared to the less intensive AA/TSF intervention (MD ‐0.07, 95% CI ‐0.08 to ‐0.06; P < 0.001; 1 study, 113 participants; Analysis 3.6).
3.6. Analysis.
Comparison 3: 2A Grouping: RCT/quasi‐RCT, all treatments manualized, compared to TSF variant, Outcome 6: European Addiction Severity Index (EuropASI)
The GRADE certainty rating for this evidence was moderate; we downgraded due to imprecision (small sample).
Indices reflecting quality of life and/or psychological well‐being
None of the studies in this category reported this outcome.
2b Studies that employed a RCT/quasi‐RCT design where at least one comparison treatment was non‐manualized and AA/TSF was compared to a different type of TSF (i.e. varying in TSF style or intensity)
We included two studies in this category (Kaskutas 2009b; Manning 2012). See Table 4 for a summary of the results for our main outcomes and certainty of evidence for each result.
Abstinence
Proportion of participants completely abstinent
Kaskutas 2009b found that the more intensive AA/TSF intervention had a higher proportion of participants abstinent at the 12‐month follow‐up compared to the less intensive AA/TSF intervention (RR 1.15, 95% CI 1.02 to 1.29; P = 0.02; 1 study, 382 participants; Analysis 4.1). The Manning 2012 study reported data for the three‐month follow‐up only, and found no difference between interventions (RR 1.16, 95% CI 0.76 to 1.79; P = 0.49; 1 study, 126 participants).
4.1. Analysis.
Comparison 4: 2B Grouping: RCT/quasi‐RCT, 1 + treatments non‐manualized, compared to TSF variant, Outcome 1: Proportion of participants completely abstinent
The GRADE certainty rating for this evidence was moderate; we downgraded due to study limitations (risk of random sequence generation, allocation concealment, and attrition bias).
Drinking intensity
Neither of the studies in this category reported this outcome.
Alcohol‐related consequences
Neither of the studies in this category reported this outcome.
Alcohol addiction severity
Neither of the studies in this category reported this outcome.
Indices reflecting quality of life and/or psychological well‐being
Neither of the studies in this category reported this outcome.
3a Studies that employed a non‐randomized design with all treatments manualized and where AA/TSF was compared to a different theoretical orientation (e.g. CBT)
We did not include any studies in this category.
3b Studies that employed a non‐randomized design with at least one non‐manualized treatment intervention and where AA/TSF was compared to a different theoretical treatment orientation (e.g. CBT)
We included four studies, reported in six papers, in this category (Blondell 2001; Humphreys 1996; Ouimette 1997; Zemore 2018). See Table 5 for a summary of the results for our main outcomes and certainty of evidence for each result.
Abstinence
Proportion of participants completely abstinent
Three studies with 3979 participants assessed this outcome (Blondell 2001; Ouimette 1997; Zemore 2018). Of note, because Ouimette 1997 compared two types of AA/TSF interventions (the purer '12‐step' intensive inpatient model and the 'eclectic' AA/TSF‐CBT hybrid inpatient model) and a standard inpatient CBT model ('C‐B'), we include here the comparison between 12‐step and CBT (because this comparison compares an AA/TSF intervention with a different theoretical orientation ‐ CBT) and in section 4b, below, we compare the 12‐step model to the eclectic intervention since these are two AA/TSF variants. All of these studies favored the AA/TSF intervention at all three follow‐up times: six months (RR 1.50, 95% CI 1.16 to 1.92; P = 0.002; 1 study, 314 participants; Analysis 5.1); 12 months (RR 1.25, 95% CI 1.09 to 1.43; P = 0.002; 2 studies, 2692 participants; Analysis 5.1); and 24 months (RR 1.34, 95% CI 1.20 to 1.49; P < 0.001; 1 study, 1774 participants; Analysis 5.1). Formal tests of between‐study heterogeneity indicated very low probability of heterogeneity at the six‐month follow‐up (Tau2 = 0.00, P = 0.46, I2 = 0%) and a moderate probability of heterogeneity at the 12‐month follow‐up (Tau2 = 0.01, P = 0.14, I2 = 46%).
The GRADE certainty rating for this evidence was very low; we downgraded because of study limitations (lack of control of sample selection and non‐randomized nature of the study).
Percentage days abstinent
None of the studies in this category reported this outcome.
Longest period of abstinence
None of the studies in this category reported this outcome.
Drinking intensity
Just one study in this category reported drinking intensity in terms of drinks per drinking day (DDD) (Humphreys 1996), which were calculated from ounces of pure ethanol consumed (based on a standard USA drink of 14 g/drink) and found no difference between interventions at 36‐month follow‐up (MD 0.00, 95% CI ‐3.38 to 3.38; P = 1.00; 1 study, 201 participants; Analysis 5.2).
The GRADE certainty rating for this evidence was very low; we downgraded due to imprecision (moderate sample size) and indirectness (comparability of cohorts for baseline characteristics and outcome measures, and protection against contamination).
Alcohol‐related consequences
Two studies reported this outcome (Humphreys 1996; Zemore 2018). Zemore 2018 found no difference at the 12‐month follow‐up (MD ‐0.71, 95% CI ‐1.68 to 0.27; P = 0.15; 1 study, 647 participants; Analysis 5.3). Similarly, Humphreys 1996 found no difference at the 36‐month follow‐up (MD 0.20, 95% CI ‐1.34 to 1.74; P = 0.80; 1 study, 201 participants; Analysis 5.4).
The GRADE certainty rating for this evidence was very low; we downgraded due to study limitations (lack of control of sample selection and non‐randomized nature of the study); and indirectness (comparability of cohorts for baseline characteristics and outcome measures, and protection against contamination).
Alcohol addiction severity
Just one study reported alcohol addiction severity in this category; Humphreys 1996 used the Alcohol Dependence Scale, and found no difference between interventions (MD ‐0.30, 95% CI ‐2.20 to 1.60; P = 0.76; 1 study, 201 participants; Analysis 5.5).
The GRADE certainty rating for this evidence was very low; we downgraded due to imprecision (moderate sample size) and indirectness (comparability of cohorts for baseline characteristics and outcome measures, and protection against contamination).
Indices reflecting quality of life or psychological well‐being, or both
None of the studies in this category reported this outcome.
4a Studies that employed a non‐randomized design with all treatments manualized and where AA/TSF was compared to a different type of TSF (i.e. varying in style or intensity)
We did not include any studies in this category.
4b Studies that employed a non‐randomized design with at least one non‐manualized treatment intervention and where AA/TSF was compared to a different TSF variant (i.e. in varying in TSF style or intensity)
We included two studies, reported in four papers, in this category (Grant 2018; Ouimette 1997). See Table 6 for a summary of the results for our main outcomes and certainty of evidence for each result.
Abstinence
Proportion of participants completely abstinent
At six‐month follow‐up Grant 2018 found no difference between interventions (RR 1.01, 95% CI 0.86 to 1.19; P = 0.90; 1 study, 140 participants), and at the 12‐month follow‐up Ouimette 1997 found an advantage for the more intensive 12‐step‐oriented treatment (RR 1.24, 95% CI 1.05 to 1.46; P = 0.01; 1 study, 1870 participants; Analysis 6.1).
The GRADE certainty rating for this evidence was very low; we downgraded due to study limitations (risk of attrition bias).
Percentage days abstinent
Only the Grant 2018 study reported this outcome and found no difference between interventions (MD ‐0.01, 95% CI ‐7.14 to 7.12; P = 1.00; 1 study, 140 participants; Analysis 6.2).
The GRADE certainty rating for this evidence was very low; we downgraded due to study limitations (risk of attrition bias) and due to imprecision (moderate sample size).
Longest period of abstinence
None of the studies in this category reported this outcome.
Drinking intensity
As shown in Analysis 6.3, only the Grant 2018 study reported this outcome, and only at six‐month follow‐up. It should be noted that this study reported drinks per drinking day (DDD) only for those participants who were not abstinent during the follow‐up period (25 participants) and found no difference in DDD between the rural‐adapted intensive referral (RAIR) (mean 17.63, SD 23.71) and the standard referral (SR) (mean 11.47, SD 5.94), P = 0.49.
The GRADE certainty rating for this evidence was very low; we downgraded due to study limitations (risk of attrition bias) and due to imprecision (moderate sample size). We conducted a narrative synthesis and therefore estimates are not precise.
Alcohol‐related consequences
None of the studies in this category reported this outcome.
Alcohol addiction severity
Grant 2018 was the only study to report this outcome, measured with ASI‐Lite, and found no difference between interventions (MD 0.01, 95% CI ‐0.05 to 0.07; P = 0.74; 1 study, 140 participants; Analysis 6.4).
The GRADE certainty rating for this evidence was very low; we downgraded due to study limitations (risk of attrition bias) and due to imprecision (moderate sample size).
Indices reflecting quality of life and/or psychological well‐being
None of the studies in this category reported this outcome.
5 Economic analysis studies (e.g. healthcare cost offset)
As noted previously, given that AA/TSF interventions attempt to link people with AUD to freely available AA meetings, and that other individuals may go directly to AA instead of pursuing professionally‐provided treatment, an important consideration is the extent to which participation in such meetings can help reduce healthcare costs by reducing reliance on more expensive, professionally‐delivered treatments in favor of the peer‐led AA groups. We included five reports relating to four studies (1 RCT/quasi‐RCT, and 3 non‐randomised) with 2657 participants that addressed the potential healthcare cost offset from AA participation (Humphreys 1996; Holder 2000 (from the MATCH 1997 study); Humphreys 2001 and Humphreys 2007 (from the Mundt 2012 study); Ouimette 1997). See Table 7 for a summary of the results for our main outcomes and certainty of evidence for each result.
The GRADE certainty rating for this evidence was moderate; we downgraded due to random sequence generation bias, problems with comparability of cohorts at baseline; and protection against contamination between study interventions.
Methodological quality
In keeping with the Cochrane recommendations for appraising the methodological quality of economic studies (Shemilt 2011b), we evaluated each of the four primary economic studies using a 19‐item checklist to assess study quality (Evers 2005). Overall, we deemed the four studies to be of high quality given that they met between 16 and 18 of the 19 criteria used in the checklist to appraise quality (see Table 10).
3. Assessment of methodological quality of economic evaluationsa.
| Item number | Item | Humphreys 1996 | Holder 2000 | Humphreys 2001, Humphreys 2007 | Mundt 2012 |
| 1 | Is the study population clearly described? | 1 | 1 | 1 | 1 |
| 2 | Are competing alternatives clearly described? | 1 | 1 | 1 | 1 |
| 3 | Is a well‐defined research question posed in answerable form? | 1 | 1 | 1 | 1 |
| 4 | Is the economic study design appropriate to the stated objective? | 1 | 1 | 1 | 1 |
| 5 | Is the chosen time horizon appropriate to include relevant costs and consequences? | 1 | 1 | 1 | 1 |
| 6 | Is the actual perspective chosen appropriate? | 1 | 1 | 1 | 1 |
| 7 | Are all important and relevant costs for each alternative identified? | 1 | 1 | 1 | 1 |
| 8 | Are all costs measured appropriately in physical units? | 1 | 1 | 1 | 1 |
| 9 | Are costs valued appropriately? | 1 | 1 | 1 | 1 |
| 10 | Are all important and relevant outcomes for each alternative identified? | 1 | 1 | 1 | 1 |
| 11 | Are all outcomes measured appropriately? | 1 | 1 | 1 | 1 |
| 12 | Are outcomes valued appropriately? | 1 | 1 | 1 | 1 |
| 13 | Is an incremental analysis of costs and outcomes of alternatives performed? | 1 | 1 | 1 | 1 |
| 14 | Are all future costs and outcomes discounted appropriately? | N/Ab | N/Ab | N/Ac | N/Ad |
| 15 | Are all important variables, whose values are uncertain, appropriately subjected to sensitivity analysis? | N/Ae | N/Af | N/Af | 1 |
| 16 | Do the conclusions follow from the data reported? | 1 | 1 | 1 | 1 |
| 17 | Does the study discuss the generalizability of the results to other settings and patient/client groups? | 1 | 1 | 1 | 1 |
| 18 | Does the article indicate that there is no potential conflict of interest of study researcher(s) and funder(s)? | 0 | 0 | 0 | 1 |
| 19 | Are ethical and distributional issues discussed appropriately? | 1g | 1g | 1g | 1g |
| Total | 16 | 16 | 16 | 18 |
aAccording to Evers 2005. bThe data were retrospective analyses over a period of three years. cThe data were retrospective analyses over a period of one year (2001) and two years (2007). dThe data were retrospective analyses over a period of seven years. eWe made this N/A because none of the values were 'uncertain', but rather estimated based on Veterans Affairs clinical data costs. rWe made this N/A because none of the values were 'uncertain'. gWe understood this to mean the potential for the benefits to healthcare system utilizers because they could obtain the same effects or better from AA instead of utilizing health care.
Healthcare cost savings
Three out of the four included studies in this category (4 out of 5 reports; Humphreys 1996; Humphreys 2001; Humphreys 2007; Ouimette 1997) found an important healthcare cost saving in favor of the AA/TSF intervention. Humphreys 1996 found that at baseline, the AA group had a worse prognosis, as characterized by lower income, less education, and more adverse consequences from alcohol use than did individuals entering professionally‐provided outpatient treatment. Despite this, across the three‐year follow‐up period, AA participants had alcohol‐related outcomes similar to the outpatient treatment group. Furthermore, the treatment costs for the AA group were 45% lower than the outpatient group, at USD 1826 less per person based on 1994 US dollars (equivalent to USD 2856 in 2018 US dollars). In the Ouimette 1997 study, Humphreys 2001 found that compared with inpatients in CBT programs, inpatients in AA/TSF programs had greater involvement in AA self‐help groups at post‐treatment follow‐up. In contrast, participants treated in CBT programs averaged almost twice as many outpatient continuing care visits after discharge (22.5 visits) as participants treated in 12‐step treatment programs (13.1 visits), and also received more days of inpatient care (17.0 days in CBT versus 10.5 in 12‐step), resulting in 64% higher annual costs for the participants initially treated in the CBT programs, or USD 4729 per patient (equivalent to USD 7128 in 2018 US dollars; P = 0.001). Psychiatric and substance use outcomes were comparable across treatments, except that AA/TSF participants had higher rates of abstinence at follow‐up (45.7% versus 36.2% for participants from CBT programs; P = 0.001). Similarly, in a subsequent analysis of the two‐year outcomes and healthcare costs, participants initially in the CBT programs relied more on outpatient and inpatient mental health services, leading to 30% lower costs among participants initially in the AA/TSF treatment programs. The two‐year follow‐up notably showed that in the previous 12 months costs for AA/TSF participants had been reduced by USD 2440 per patient (equivalent to USD 3678 in 2018 US dollars; P = 0.01).
Mundt 2012 found that for each additional 12‐step group meeting attended, there was an observed incremental medical cost reduction of 4.7% during the seven‐year follow‐up. The medical cost offset was largely due to reductions in hospital inpatient days, psychiatric visits, and alcohol and other drug treatment costs culminating in an estimated total medical use cost savings of USD 145 for each 12‐step meeting attended per year (USD 180 in 2018 dollars). In the MATCH 1997 study, Holder 2000 identified substantial medical cost savings during treatment and across follow‐up; the mean estimated monthly post‐treatment costs for the three treatments (MET, CBT, AA/TSF) ranged from a low of USD 254 (MET) to a high of USD 315 (CBT) with AA/TSF in between (USD 310) (P = 0.13). The total medical care costs declined from pre‐ to post‐treatment overall and for each modality. Although matching effects independent of clinical prognosis in the analysis showed that MET had potential for medical care cost savings, this was not the case once clinical prognosis indicators were included. Specifically, participants with poor prognostic characteristics (greater alcohol addiction severity, psychiatric severity and/or social network support favoring alcohol use) had better cost savings potential with CBT or TSF, or both, than with MET.
Discussion
Summary of main results
The current review demonstrates that Alcoholics Anonymous/Twelve‐Step Facilitation (AA/TSF) is superior to other well‐established treatments when it comes to increasing abstinence, and is at least as effective as other well‐established treatments for other alcohol‐related outcomes such as drinking consequences, drinking intensity, and addiction severity. AA/TSF also appears to produce important healthcare cost offsets. The benefits of AA and TSF were observed in rigorous trials, as well as less rigorous, non‐randomized studies. Although AA/TSF was not consistently superior when compared to well‐established treatments or less‐intensive TSF, it was at least as helpful for reducing the intensity of drinking and alcohol‐related consequences, and in lowering severity of alcohol addiction. In addition, when different types of TSF interventions were tested against each other, the more intensive TSF interventions (e.g. those that include actively prescribing AA participation and ongoing monitoring of AA attendance and related experiences; personal linkages to existing AA members) often worked better at improving drinking‐related outcomes than the 'treatment as usual (TAU) TSF' intervention. This suggests that although many treatment professionals may believe that they "already do 12‐step" (i.e. implement TSF strategies) because they hand out 12‐step literature or mention 12‐step groups to patients, this alone may not be sufficient to achieve a superior benefit (Kelly 2013c). The types of TSF strategies used matter, and the more intensive strategies, such as those evaluated herein, enhance participation rates and outcomes compared to the more routine 12‐step‐oriented TAU. Some of these strategies could be clinical linkage to existing members (e.g. Manning 2012; Timko 2006), or active prescription of attendance versus leaving it to people to decide for themselves whether they want to attend AA (e.g. Walitzer 2009). It is worth noting that, because many participants in these studies assigned to non‐TSF interventions still elected to attend AA (participation in which is correlated with better outcomes), the positive effects of AA/TSF interventions, where observed, are likely to be conservative. Also, as detailed below, the reason why AA/TSF outperforms other well‐established treatments is because it successfully links people to a free, ubiquitous, long‐term recovery, peer support organization (i.e. AA) that, in turn, mobilizes other therapeutic mechanisms ‐ such as increasing relapse prevention coping skills, abstinence self‐efficacy, recovery motivation, and reducing craving and impulsivity ‐ and facilitates recovery‐supportive changes in people's social networks (Kelly 2009b; Kelly 2017a).
Overall completeness and applicability of evidence
Follow‐up after intervention ranged from three to 60 months, with a modal length of 12 months (see Table 8). On the whole, study samples were quite large and adequately powered to detect effects. However, sample sizes were highly variable and skewed across studies, ranging from a low of 48 participants in Kahler 2004 to a high of 3018 in Ouimette 1997, with an average of 400 participants per study (mean 406.4; SD 616.2; median 201). Measurement in the included studies comprised psychometrically validated assessment tools.
Overall, the review found that in scientifically rigorous, randomized controlled trials (RCTs) that compared AA/TSF to interventions of a different theoretical orientation (e.g. cognitive behavioral therapy (CBT), motivational enhancement therapy (MET)), where all treatments were manualized and delivered with high degrees of objectively rated clinical fidelity, AA/TSF interventions most often produced increased rates of continuous abstinence of large magnitude compared to interventions such as CBT and MET, which many people have considered to be state‐of‐the‐art behavioral interventions for alcohol use disorder (AUD). For instance, in MATCH 1997 the proportion of participants completely abstinent throughout the entire first year following the intervention among outpatients who were assigned to the AA/TSF intervention was 24%, whereas 15% and 14% of participants assigned to CBT and MET, respectively, were completely abstinent during that timeframe. This reflects an absolute advantage of 9 percentage points in favor of AA/TSF, and a relative advantage for AA/TSF compared to CBT of 60% in the number of participants completely abstinent, and when compared to MET, reflects an increase of 64% in the number of participants completely abstinent. This pattern of relative advantage for AA/TSF interventions on this outcome appeared quite consistent across both RCTs/quasi‐RCTs and non‐randomized studies.
Also, although the magnitude was not as large, the average percentage of days on which participants were abstinent (PDA), tended to show an advantage in favor of AA/TSF interventions, especially in the more rigorous RCTs with manualized therapies compared to other active treatment orientations (e.g. CBTs), but studies involving young people (Kelly 2017b), and couples therapy (McCrady 1996), showed equivalence, but not advantages for PDA. Also of note, one study with dual diagnosis participants in the Veterans Administration (VA) healthcare system (Lydecker 2010), found a disadvantage for PDA with AA/TSF. This may be because, although participants met criteria for AUD, the primary problem was mood disorder as opposed to AUD, which may represent a poorer fit with AA (Kelly 2003a). That said, a recent meta‐analysis by Tonigan 2018 found fairly consistent abstinence benefits from participation in AA by dually‐diagnosed individuals. Thus, it is currently not clear why the Lydecker 2010 study did not find benefits, but similar to the Kelly 2003a findings, it may relate to the specific treatment of severe major depression in particular, or perhaps idiosyncrasies related to military veterans, or being treated in the VA healthcare system. More work is needed to clarify this.
For measures of intensity of drinking, AA/TSF most often performed as well as comparison interventions. This is, perhaps, surprising given that the major focus of AA/TSF interventions is on complete abstinence, rather than reductions in intensity, which may be of a focus in CBT‐oriented relapse prevention interventions. Of note, however, was that despite a greater relative emphasis on reducing the intensity of any drinking that might occur in CBT interventions (e.g. through a focus on coping with the abstinence violation effect) in no case did AA/TSF fare worse on this outcome, and, where there were differences, AA/TSF showed an advantage. Consquently, these findings do not support the once‐popular theory that by emphasizing the uncontrollability of alcohol consumption (i.e. 'powerlessness' over alcohol), AA creates an abstinence violation effect that makes the relapses more severe (Marlatt 1985).
In terms of reductions in alcohol‐related consequences and alcohol addiction severity, AA/TSF most often did as well as comparison treatments. Notably, however, three out of four of the TSF variant studies, reflected advantages for more intensive AA/TSF procedures versus less intensive AA/TSF procedures (Brown 2002; Timko 2006; Vederhus 2014), suggesting that better articulated and more intensive TSF strategies (e.g. peer linkage) may produce better results for these outcomes.
Importantly, when compared to TAU AA/TSF interventions, the Timko 2006 and Kaskutas 2009b studies both showed advantages for the more intensive AA/TSF. This suggests the potential importance of not just recommending and referring people to AA, but of being strategic and deliberate in the methods used to get patients connected with AA. Methods highlighted in these studies, indicate those strategies (i.e. direct linkage to existing AA members; explicit focus on the major elements of AA meetings, sponsorship, and referral with clinical monitoring and discussion of AA participation during the active AA/TSF clinical treatment) were clinically superior. Notably, in the Walitzer 2009 study the more directive style of TSF was superior to the client‐centered motivational interviewing style of TSF, for increasing AA engagement and enhancing clinical alcohol use outcomes. Thus, while motivational interviewing styles are popular, people may be more likely to have better outcomes if AA participation is actively prescribed, recommended, and monitored, by clinicians, rather than left for the patient alone to consider and decide. Furthermore, when compared to the eclectic/TSF interventions in the Ouimette 1997 study, the purer, more intensive,TSF treatment was superior for increasing complete abstinence among participants. This was also the case for the Litt 2007 study, which found a AA/TSF advantage for the continuous abstinence and PDA outcomes that was not enhanced by adding contingency management. This suggests that keeping an undiluted and consistent central theoretical focus could yield better clinical dividends than a combination or 'kitchen sink' approach that attempts to include the 'best of' other interventions. That said, more research is needed in this regard, because when the Walitzer 2009 study combined TSF and CBT approaches (using a more directive and prescriptive AA/TSF style), it outperformed the two comparison interventions (CBT alone and CBT with a motivational interviewing‐TSF style).
The economic analyses found benefits in favor of AA/TSF compared to outpatient treatment, and CBT interventions. The magnitude of these benefits can be sizeable. For example, the economic analysis of the Ouimette 1997 study (Humphreys 2001 and Humphreys 2007) found that, in addition to increasing abstinence rates, AA/TSF interventions were able to reduce the mental health and substance use related healthcare costs over the next two years by over USD 10,000 per patient (when 1994 figures are converted to 2018 USD) compared to CBT interventions delivered in residential VA settings. More than one million people are treated for AUD in the USA every year and reducing each of their healthcare costs by this amount would produce an enormous aggregate economic saving (more than USD 10 billion in the US alone), as well as improving clinical outcomes.
The goal of TSF is to stimulate AA participation during and following treatment, but TSF itself is not AA. The theoretical causal chain that may underlie the advantage of TSF clinical interventions is that AA/TSF leads to higher abstinence rates via its strong ability to get people with AUD involved in AA (Kelly 2009b; Kelly 2017a; Litt 2007; Longabaugh 1998; MATCH 2001; Walitzer 2009). Several studies, including two comparative clinical trials that were included in the current review, have examined this. In these, use of appropriate temporally‐lagged mediational analyses supported a causal chain in which TSF led to higher AA participation, which subsequently led to better alcohol use outcomes (Litt 2007; Walitzer 2009). Specifically, the Litt 2007 study found post‐treatment AA attendance partially mediated the effect of the TSF Network Support treatment on PDA (particularly post‐treatment PDA), and Walitzer 2009 found that AA involvement during treatment and at six‐month follow‐up increased subsequent PDA. Such studies demonstrate that TSF is able to increase AA participation and by doing so, AA leads to better alcohol use outcomes.
The lack of reporting of any outcomes regarding quality of life, functioning, or psychological well‐being was noteworthy.
Certainty of the evidence
The certainty of the evidence in this review was generally appraised as very low to high using the GRADE rating system (Schunemann 2013). This was driven by the rigor of the included studies. Specifically, both RCTs/quasi‐RCTs and non‐randomized studies were permissible as long as they met the other inclusion criteria (e.g. had a comparison intervention). Consequently, by default, we generally judged the evidence of non‐randomized studies (of which there were 5 of 27) to be of low certainty (as recommended by the GRADE system), while we judged RCTs/quasi‐RCTs generally to be of higher certainty. There was some inconsistency in the evidence across studies that could be due to variation in the clinical characteristics of the samples used, follow‐up time points, error in memory recall for certain outcomes, and differences in intervention durations, or therapist effects. There were some small sample sizes and larger variability around mean estimates of the longest periods of abstinence, and high variability around mean estimates of DDD. Although we observed heterogeneity in the magnitude of the effects for AA/TSF in comparison to other treatments or TSF variants, the direction of the findings in almost every case was in the same direction, with AA/TSF doing as well as, or better than, comparison interventions. There was only one instance where this was not the case, as detailed above in the results section (i.e. Lydecker 2010).
Potential biases in the review process
AA/TSF and comparison interventions varied substantially in duration, intensity, style, theoretical orientation, degree of manualization, and content. Potential biases may have arisen due to the decision to pool data from this wide range of studies. This mix of interventions, whilst not necessarily impacting the amount of statistical variation between the results of the studies, does reflect a high degree of heterogeneity which can affect generalizability of the findings.
We were not able to perform an analysis of publication bias, but consider it unlikely that we missed any high quality studies. Also, in some instances not all relevant information could be obtained, and in terms of at least some of the bias ratings, such as reporting bias, they can be difficult to assess and thus, some aspects of these ratings remain unclear. Despite this, the bias across the multiple dimensions was low in the RCTs/quasi‐RCTs, and increased as expected in the non‐randomized studies (Figure 4). Two studies focused on young people (Kelly 2017b; Mundt 2012), but were included despite having some participants under the age of 18 years old at study onset, because the majority (as in Kelly 2017b), or all of the participants (as in Mundt 2012), were 18 years old or older during the follow‐up periods. (Including or omitting these studies from the review, did not alter the pattern of findings.) It is worth noting that most of the studies were conducted in the USA, where AA originated and is widely available. The extent to which these results are generalizable across other cultures where AA may be less readily available is not clear. Also, studies are needed to determine if there are ethnic or racial differences in the benefits derived from AA/TSF within different societies.
Agreements and disagreements with other studies or reviews
The evidence contained in this review is similar to, and extends that of the prior Cochrane Review (Ferri 2006b), which this review updates and replaces, as well as of other narrative reviews which found overall positive effects for AA/TSF interventions (e.g. Kaskutas 2009a; Kelly 2003b). The results presented in this review are also supported by other published analyses. One study from Project MATCH (Longabaugh 1998), found that regardless of whether outpatients' pre‐treatment network was supportive or unsupportive of alcohol use at treatment intake, AA/TSF participants were more likely to be involved with AA, which in turn, subsequently explained the observed lower drinks per drinking day (DDD) and greater PDA advantages for TSF‐treated participants observed at the 36‐month follow‐up. The prior Cochrane Review contained eight studies with 3417 participants (Ferri 2006b), and found that on the whole, AA/TSF interventions were as effective, but not more effective, than the interventions to which they were compared. This new review is based on 27 studies reported in 36 articles and has a total of 10,565 participants. It is considerably larger, comprises more rigorous studies, and found that, compared to other active psychosocial interventions for AUD, AA/TSF interventions often produce greater abstinence ‐ notably continuous abstinence ‐ as well as some reductions in drinking intensity, fewer alcohol‐related consequences, and lower alcohol addiction severity. This review also included economic analyses, which augments prior reviews and adds important information regarding the cost‐benefits of providing AA/TSF in clinical settings.
Authors' conclusions
Implications for practice.
The evidence suggests that compared to other well‐established treatments, clinical linkage using well‐articulated Twelve‐Step Facilitation (TSF) manualized interventions intended to increase Alcoholics Anonymous (AA) participation during and following alcohol use disorder (AUD) treatment probably will lead to enhanced abstinence outcomes over the next few months and for up to three years. Findings also indicate AA/TSF may perform as well as other clinical interventions for drinking intensity outcomes; however, these results are based largely on low certainty evidence and so should be regarded with caution.
Economic analyses suggest probable substantial healthcare cost savings can be obtained when treatment programs proactively and systematically link people with AUD to AA using TSF strategies, such as those used in the studies included in this review. The analyses indicate that the reason for this benefit is due to the ability of the AA/TSF to increase AA participation, and thereby increase abstinence rates. Thus, a relatively brief clinical intervention (AA/TSF) can help people with AUD to become engaged in a long‐term, freely available, community‐based, recovery support resource that can help them sustain ongoing remission.
If people with AUD are opposed to attending AA, despite the strong evidence for its potential to aid recovery, clinicians might consider linkage to alternative mutual‐help organizations as they may confer benefits at similar levels of engagement. Alternatives might also be considered when a patient has made a sustained effort to engage AA, but not derived sufficient benefit from it.
Implications for research.
Since the publication of the National Institutes of Health‐sponsored AA research monograph summarizing the research on AA up until the early 1990s (McCrady 1993), numerous RCTs/quasi‐RCTs and well‐controlled comparative non‐randomized studies have been conducted using professionally‐delivered TSF interventions. In addition, research into sophisticated mechanisms of behavior change has been conducted to delineate the precise ways that AA participation confers recovery benefit (see Kelly 2009a; Kelly 2017a). While these reviews have advanced our knowledge in this area, several further avenues of research remain to be explored.
Most of this research was conducted in the USA; further research is needed to determine the degree to which results observed here differ in other countries.
None of the studies included in this review reported on any outcomes regarding quality of life, functioning, or psychological well‐being. There is increasing interest and importance being placed on these important indices in addition to substance‐related outcomes (Kelly 2018), and new studies should gather data for these outcomes.
It is plausible that participation of family members in 12‐step organizations designed specifically to help family members cope with the effects of active addiction in their loved one (i.e. Al‐Anon) may partially mediate the effects of AA participation on the individual with an AUD by altering the family and relationship dynamics in a therapeutic way. Future research should examine this and also the broader impact of AA/TSF on other special populations such as adolescents, senior citizens, and those who identify as LGBTQ (lesbian, gay, bisexual, transgender, questioning).
Some research has examined the utility of AA for people suffering from other common substance use disorders (e.g. disorders relating to cocaine, cannabis, opioids use, etc.) either alone or in combination with AUD (Kelly 2014). More research is needed to understand the degree to which these people might benefit from, or be a better fit in, other mutual‐help organizations, such as Narcotics Anonymous, or Cocaine Anonymous (Bøg 2017). Studies also suggest there may be an immense clinical and public health value and economic benefit of AA participation in reducing healthcare costs. Such analyses could be expanded to include the potential gains in economic revenue from increased employment or productivity, or both, and also reductions in criminal justice costs related to lowered criminal activity that might result from increased AA participation.
Finally, although this review focused on AA/TSF interventions and alcohol use outcomes, it is plausible that other AUD recovery‐supportive, mutual‐help organizations, such as Self‐Management and Recovery Training (SMART), LifeRing, and Women for Sobriety, that have been growing in recent years, may confer similar benefits (Kelly 2012; Kelly 2009b). While these organizations may espouse different theoretical orientations and variations in their approaches to help people attain and maintain recovery from AUD, there may be more similarity than differences in the therapeutic dynamics operating within these groups (Kelly 2009b; Kelly 2017a), and we need more research to understand whether participants who engage with these other entities may derive benefits of similar magnitude to those derived from AA (Zemore 2017). More research is needed to support this conjecture, but such preliminary results are promising from a public health and long‐term recovery management perspective because AUD tends to be highly heterogeneous in its clinical course and impact, and those suffering can often have different preferences as to the kinds of recovery pathways they wish to follow (Kelly 2013c).
What's new
| Date | Event | Description |
|---|---|---|
| 10 September 2020 | Amended | Minor typos corrected. |
History
Protocol first published: Issue 11, 2017 Review first published: Issue 3, 2020
| Date | Event | Description |
|---|---|---|
| 12 March 2020 | Amended | Minor amendment to abstract |
Acknowledgements
The authors thank:
Ms Alexandra Abry for her help in all aspects of the administration and publication of this review;
Ms Zuzanna Mitrova for her assistance with the literature searches;
Dr Brandon Bergman, PhD, for his assistance in helping with review administration and providing feedback and comments on this review.
Appendices
Appendix 1. Search strategy
Cochrane Central Register of Controlled Trials (CENTRAL) in the Cochrane Library
#1 MeSH descriptor: [Alcohol‐Related Disorders] explode all trees
#2 MeSH descriptor: [Drinking Behavior] explode all trees
#3 alcoholism:ti,ab,kw (Word variations have been searched)
#4 alcohol:ti,ab,kw (Word variations have been searched)
#5 #1 or #2 or #3 or #4
#6 MeSH descriptor: [Self‐Help Groups] explode all trees
#7 self next help next group*
#8 alcoholic* near/2 anonymou*
#9 mutual next help
#10 mutual next aid
#11 twelve next step*
#12 #6 or #7 or #8 or #9 or #10 or #11
#13 #5 and #12
Cochrane Drugs and Alcohol Group Specialized Register
#1 alcohol*:ti,ab,kw,xdi AND INREGISTER
#2 self next help next group* AND INREGISTER
#3 twelve near2 step AND INREGISTER
#4 12 near2 step AND INREGISTER
#5 (mutual near2 (help OR aid)) AND INREGISTER
#6 self help AND INREGISTER
#7 #2 OR #3 OR #4 OR #5 OR #6
#8 #7 AND #1
MEDLINE PubMed
#1 Alcohol‐Related Disorders[Mesh]
#2 Drinking Behavior[Mesh]
#3 alcohol*[tiab]
#4 #1 OR #2 OR #3
#5 Self‐Help Groups[Mesh]
#6 self help group*[tiab]
#7 alcoholic* anonymou* [tiab]
#8 "mutual help" [tiab]
#9 "mutual aid" [tiab]
#10 twelve step* [tiab]
#11 12 step* [tiab]
#12 #5 OR #6 OR #7 OR #9 OR #10 OR #11
#13 #4 AND #12
Embase Ovid
#1 exp alcohol abuse/
#2 exp alcoholism/
#3 (alcohol adj3 (drink* or use* or abus* or misus* or risk* or consum* or withdraw* or detox* or
treat* or therap* or excess* or reduc* or cessation or intervention)).ti,ab.
#4 (drink* adj3 (excess or heavy or heavily or harmful or problem*)).ti,ab.
#5 exp drinking behaviour/
#6 1 or 2 or 3 or 4 or 5
#7 exp self help/
#8 (self adj2 help adj2 group$).ti,ab.
#9 (twelve adj2 step).ti,ab.
#10 12‐step.ti,ab.
#11 exp alcoholics anonymous/
#12 (alcoholic$ adj anonymou$).ti,ab.
#13 (mutual adj2 (help or aid)).ti,ab.
#14 7 or 8 or 9 or 10 or 11 or 12 or 13
#15 6 and 14
CINAHL EBSCO (Cumulative Index to Nursing and Allied Health Literature)
#1 (MH "Alcohol Abuse")
#2 (MH "Drinking Behavior+")
#3 TI ((drug or substance*) N2 (abuse or misuse* or addict* or dependen*) ) OR AB ( (drug or
substance*) N2 (abuse or misuse* or addict* or dependen*) )
#4 TI alcohol* OR AB alcohol*
#5 S1 OR S2 OR S3 OR S4
#6 (MH "Alcohol Rehabilitation Programs+")
#7 TI self help w2 group* OR AB self help w2 group*
#8 TI twelve W2 step OR AB twelve W2 step
#9 TI( twelve W2 step) or TI(12 W2 step) or AB( twelve W2 step) or AB(12 W2 step)
#10 TI mutual W2 help OR AB mutual W2 help
#11 TI mutual W2 aid OR AB mutual W2 aid
#12 (MH "Alcoholics Anonymous")
#13 TI( alcoholic* W2 anonymou* ) or AB( alcoholic* W2 anonymou* )
#14 S6 OR S7 OR S8 OR S9 OR S10 OR S11 OR S12 OR S13
#15 S5 AND S14
PsycINFO
#1 AB ( “12 step” OR “12‐step” OR “twelve step” OR “twelve‐step” OR “TSF” OR “alcoholics anonymous” OR “AA” ) AND AB ( “Alcohol*” OR “cost‐benefit” OR “cost benefit” OR “cost‐offset” OR “cost‐offset” OR “cost‐effectiveness” OR “cost effectiveness” )
#2 AB ( “12 step” OR “12‐step” OR “twelve step” OR “twelve‐step” OR “TSF” OR “alcoholics anonymous” OR “AA” ) AND TI ( “Alcohol*” OR “cost‐benefit” OR “cost benefit” OR “cost‐offset” OR “cost‐offset” OR “cost‐effectiveness” OR “cost effectiveness” )
#3 TI ( “12 step” OR “12‐step” OR “twelve step” OR “twelve‐step” OR “TSF” OR “alcoholics anonymous” OR “AA” ) AND AB ( “Alcohol*” OR “cost‐benefit” OR “cost benefit” OR “cost‐offset” OR “cost‐offset” OR “cost‐effectiveness” OR “cost effectiveness” )
#4 TI ( “12 step” OR “12‐step” OR “twelve step” OR “twelve‐step” OR “TSF” OR “alcoholics anonymous” OR “AA” ) AND TI ( “Alcohol*” OR “cost‐benefit” OR “cost benefit” OR “cost‐offset” OR “cost‐offset” OR “cost‐effectiveness” OR “cost effectiveness” )
Appendix 2. Criteria for 'Risk of bias' assessment of randomized controlled trials (RCTs), quasi‐RCTs, and prospective observational studies that include a comparison group
| Item | Judgment | Description |
| 1. Random sequence generation (selection bias) | Low risk | The investigators describe a random component in the sequence generation process, such as: random number table; computer random number generator; coin tossing; shuffling cards or envelopes; throwing dice; drawing of lots; minimization |
| High risk | The investigators describe a non‐random component in the sequence generation process, such as: odd or even date of birth; date (or day) of admission; hospital or clinic record number; alternation; judgment of the clinician; results of a laboratory test or a series of tests; availability of the intervention or observational prospective study |
|
| Unclear risk | Insufficient information to permit judgment of low or high risk | |
| 2. Allocation concealment (selection bias) | Low risk | Investigators enrolling participants could not foresee assignment because one of the following, or an equivalent method, was used to conceal allocation: central allocation (including telephone, web‐based, and pharmacy‐controlled, randomization); sequentially numbered drug containers of identical appearance; sequentially numbered, opaque, sealed envelopes |
| High risk | Investigators enrolling participants could possibly foresee assignments because one of the following method was used: open random allocation schedule (e.g. a list of random numbers); assignment envelopes without appropriate safeguards (e.g. if envelopes were unsealed or nonopaque or not sequentially numbered); alternation or rotation; date of birth; case record number; any other explicitly unconcealed procedure Observational prospective study |
|
| Unclear risk | Insufficient information to permit judgment of low or high risk. This is usually the case if the method of concealment is not described or not described in sufficient detail to allow a definite judgment | |
| 3a. Blinding of outcome assessor (detection bias) Objective outcomes |
Low risk | No blinding of outcome assessment, but the review authors judge that the outcome measurement is not likely to be influenced by lack of blinding; blinding of outcome assessment ensured, and unlikely that the blinding could have been broken Record linkage |
| High risk | No blinding of outcome assessment, and the outcome measurement is likely to be influenced by lack of blinding; blinding of outcome assessment, but likely that the blinding could have been broken, and the outcome measurement is likely to be influenced by lack of blinding |
|
| Unclear risk | Insufficient information to permit judgment of low or high risk | |
| 3b. Blinding of outcome assessor (detection bias) Subjective outcomes |
Low risk | No blinding of outcome assessment, but the review authors judge that the outcome measurement is not likely to be influenced by lack of blinding; blinding of outcome assessment ensured, and unlikely that the blinding could have been broken |
| High risk | No blinding of outcome assessment, and the outcome measurement is likely to be influenced by lack of blinding; blinding of outcome assessment, but likely that the blinding could have been broken, and the outcome measurement is likely to be influenced by lack of blinding |
|
| Unclear risk | Insufficient information to permit judgment of low or high risk | |
| 4. Incomplete outcome data (attrition bias) For all outcomes except retention in treatment or dropout |
Low risk | No missing outcome data; reasons for missing outcome data unlikely to be related to true outcome (for survival data, censoring unlikely to be introducing bias); missing outcome data balanced in numbers across intervention groups, with similar reasons for missing data across groups; for dichotomous outcome data, the proportion of missing outcomes compared with observed event risk not enough to have a clinically relevant impact on the intervention effect estimate; for continuous outcome data, plausible effect size (difference in means or standardized difference in means) among missing outcomes not enough to have a clinically relevant impact on observed effect size; missing data have been imputed using appropriate methods; all randomized participants are reported/analyzed in the group they were allocated to by randomization irrespective of noncompliance and co‐interventions (intention‐to‐treat) |
| High risk | Reason for missing outcome data likely to be related to true outcome, with either imbalance in numbers or reasons for missing data across intervention groups; for dichotomous outcome data, the proportion of missing outcomes compared with observed event risk enough to induce clinically relevant bias in intervention effect estimate; for continuous outcome data, plausible effect size (difference in means or standardized difference in means) among missing outcomes enough to induce clinically relevant bias in observed effect size; 'as‐treated' analysis done with substantial departure of the intervention received from that assigned at randomization |
|
| Unclear risk | Insufficient information to permit judgment of low or high risk (e.g. number randomized not stated, no reasons for missing data provided; number of dropouts not reported for each group) | |
| 5. Selective reporting (reporting bias) | Low risk | The study protocol is available and all of the study's prespecified (primary and secondary) outcomes that are of interest in the review have been reported in the prespecified way; the study protocol is not available but it is clear that the published reports include all expected outcomes, including those that were prespecified (convincing text of this nature may be uncommon) |
| High risk | Not all of the study's prespecified primary outcomes have been reported; one or more primary outcome(s) is reported using measurements, analysis methods, or subsets of the data (e.g. subscales) that were not prespecified; one or more reported primary outcome(s) were not prespecified (unless clear justification for their reporting is provided, such as an unexpected adverse effect); one or more outcomes of interest in the review are reported incompletely so that they cannot be entered in a meta‐analysis; the study report fails to include results for a key outcome that would be expected to have been reported for such a study |
|
| Unclear risk | Insufficient information to permit judgment of low or high risk | |
| 6. Free of other bias: comparability of cohorts for baseline characteristics and outcome measures on the basis of the design or analysis |
Low risk | Exposed and non‐exposed individuals are matched in the design for most important confounding factors; authors demonstrated balance between groups for the confounders; analyses are adjusted for most important confounding factors and imbalance; randomized controlled trial. |
| High risk | No matching or no adjustment for most important confounding factor | |
| Unclear risk | No information about comparability of cohort | |
| 7. Free of other bias: selection of the non‐exposed cohort | Low risk | The sample has been drawn from the same community as the exposed cohort |
| High risk | The sample has been drawn from a different source | |
| Unclear risk | No description of the derivation of the non‐exposed cohort | |
| 8. Free of other bias: protection against contamination | Low risk | Allocation was by community, institution, or practice and it is unlikely that the control group received the intervention |
| High risk | It is likely that the control group received the intervention | |
| Unclear risk | It is possible that communication between intervention and control groups could have occurred |
Appendix 3. Evers 2005 Health Economic Criteria
| 1 | Is the study population clearly described? |
| 2 | Are competing alternatives clearly described? |
| 3 | Is a well‐defined research question posed in answerable form? |
| 4 | Is the economic study design appropriate to the stated objective? |
| 5 | Is the chosen time horizon appropriate to include relevant costs and consequences? |
| 6 | Is the actual perspective chosen appropriate? |
| 7 | Are all important and relevant costs for each alternative identified? |
| 8 | Are all costs measured appropriately in physical units? |
| 9 | Are costs valued appropriately? |
| 10 | Are all important and relevant outcomes for each alternative identified? |
| 11 | Are all outcomes measured appropriately? |
| 12 | Are outcomes valued appropriately? |
| 13 | Is an incremental analysis of costs and outcomes of alternatives performed? |
| 14 | Are all future costs and outcomes discounted appropriately? |
| 15 | Are all important variables, whose values are uncertain, appropriately subjected to sensitivity analysis? |
| 16 | Do the conclusions follow from the data reported? |
| 17 | Does the study discuss the generalizability of the results to other settings and patient/client groups? |
| 18 | Does the article indicate that there is no potential conflict of interest of study researcher(s) and funder(s)? |
| 19 | Are ethical and distributional issues discussed appropriately? |
Data and analyses
Comparison 1. 1A Grouping: RCT/quasi‐RCT, all treatments manualized, compared to different theoretical orientation.
| Outcome or subgroup title | No. of studies | No. of participants | Statistical method | Effect size |
|---|---|---|---|---|
| 1.1 Proportion completely abstinent | 6 | Risk Ratio (M‐H, Random, 95% CI) | Subtotals only | |
| 1.1.1 End of treatment | 1 | 1726 | Risk Ratio (M‐H, Random, 95% CI) | 1.07 [0.92, 1.25] |
| 1.1.2 6‐month follow‐up | 3 | 238 | Risk Ratio (M‐H, Random, 95% CI) | 1.66 [1.09, 2.54] |
| 1.1.3 12‐month follow‐up | 2 | 1936 | Risk Ratio (M‐H, Random, 95% CI) | 1.21 [1.03, 1.42] |
| 1.1.4 24‐month follow‐up | 2 | 403 | Risk Ratio (M‐H, Random, 95% CI) | 1.37 [1.04, 1.82] |
| 1.1.5 36‐month follow‐up | 1 | 952 | Risk Ratio (M‐H, Random, 95% CI) | 1.42 [1.17, 1.73] |
| 1.2 Percentage days abstinent (PDA) | 8 | Mean Difference (IV, Random, 95% CI) | Subtotals only | |
| 1.2.1 End of treatment | 1 | 1586 | Mean Difference (IV, Random, 95% CI) | 1.91 [‐1.42, 5.24] |
| 1.2.2 6‐month follow‐up | 3 | 191 | Mean Difference (IV, Random, 95% CI) | ‐1.21 [‐10.82, 8.41] |
| 1.2.3 12‐month follow‐up | 4 | 1999 | Mean Difference (IV, Random, 95% CI) | 3.03 [‐4.36, 10.43] |
| 1.2.4 18‐month follow‐up | 1 | 58 | Mean Difference (IV, Random, 95% CI) | ‐8.89 [‐30.65, 12.87] |
| 1.2.5 24‐month follow‐up | 2 | 302 | Mean Difference (IV, Random, 95% CI) | 12.91 [7.55, 18.27] |
| 1.2.6 36‐month follow‐up | 1 | 806 | Mean Difference (IV, Random, 95% CI) | 6.64 [1.54, 11.75] |
| 1.3 Longest period of abstinence (LPA, months) | 2 | Mean Difference (IV, Random, 95% CI) | Subtotals only | |
| 1.3.1 6‐month follow‐up | 2 | 136 | Mean Difference (IV, Random, 95% CI) | 0.60 [‐0.30, 1.50] |
| 1.4 Drinks per drinking day (DDD) | 5 | Mean Difference (IV, Random, 95% CI) | Subtotals only | |
| 1.4.1 End of treatment | 2 | 1636 | Mean Difference (IV, Random, 95% CI) | ‐0.30 [‐1.07, 0.47] |
| 1.4.2 6‐month follow‐up | 1 | 76 | Mean Difference (IV, Random, 95% CI) | ‐0.96 [‐3.22, 1.30] |
| 1.4.3 12‐month follow‐up | 1 | 1516 | Mean Difference (IV, Random, 95% CI) | ‐0.17 [‐1.11, 0.77] |
| 1.4.4 24‐month follow‐up | 2 | 302 | Mean Difference (IV, Random, 95% CI) | ‐0.16 [‐0.80, 0.47] |
| 1.4.5 36‐month follow‐up | 1 | 806 | Mean Difference (IV, Random, 95% CI) | ‐1.02 [‐1.83, ‐0.21] |
| 1.5 Percentage days heavy drinking (PDHD) | 3 | Mean Difference (IV, Random, 95% CI) | Subtotals only | |
| 1.5.1 6‐month follow‐up | 1 | 70 | Mean Difference (IV, Random, 95% CI) | 9.62 [‐0.93, 20.17] |
| 1.5.2 12‐month follow‐up | 1 | 91 | Mean Difference (IV, Random, 95% CI) | ‐5.51 [‐14.15, 3.13] |
| 1.5.3 24‐month follow‐up | 1 | 129 | Mean Difference (IV, Random, 95% CI) | ‐1.09 [‐11.57, 9.39] |
| 1.6 Alcohol‐related consequences (DrInC) | 4 | Mean Difference (IV, Random, 95% CI) | Subtotals only | |
| 1.6.1 End of treatment | 1 | 1532 | Mean Difference (IV, Random, 95% CI) | ‐3.38 [‐8.66, 1.90] |
| 1.6.2 12‐month follow‐up | 3 | 1762 | Mean Difference (IV, Random, 95% CI) | ‐2.88 [‐6.81, 1.04] |
| 1.6.3 24‐month follow‐up | 2 | 295 | Mean Difference (IV, Random, 95% CI) | ‐2.09 [‐8.11, 3.93] |
| 1.7 Alcohol‐related consequences (SIP) | 1 | Mean Difference (IV, Random, 95% CI) | Subtotals only | |
| 1.7.1 6‐month follow‐up | 1 | 76 | Mean Difference (IV, Random, 95% CI) | 0.71 [‐4.51, 5.93] |
| 1.8 Alcohol‐related consequences (SIP‐2R) | 1 | Mean Difference (IV, Random, 95% CI) | Subtotals only | |
| 1.8.1 6‐month follow‐up | 1 | 59 | Mean Difference (IV, Random, 95% CI) | ‐0.10 [‐0.43, 0.23] |
| 1.9 Addiction Severity Index (ASI) | 1 | Mean Difference (IV, Random, 95% CI) | Subtotals only | |
| 1.9.1 6‐month follow‐up | 1 | 336 | Mean Difference (IV, Random, 95% CI) | ‐0.05 [‐0.09, ‐0.01] |
| 1.10 Addiction Severity Index (ASI) | 1 | Other data | No numeric data |
Comparison 2. 1B Grouping: RCT/quasi‐RCT, 1 + treatments non‐manualized, compared to different theoretical orientation.
| Outcome or subgroup title | No. of studies | No. of participants | Statistical method | Effect size |
|---|---|---|---|---|
| 2.1 Proportion completely abstinent | 2 | Risk Ratio (M‐H, Random, 95% CI) | Subtotals only | |
| 2.1.1 3‐month follow‐up | 1 | 126 | Risk Ratio (M‐H, Random, 95% CI) | 1.18 [0.80, 1.73] |
| 2.1.2 9‐month follow‐up | 1 | 93 | Risk Ratio (M‐H, Random, 95% CI) | 1.71 [0.70, 4.18] |
| 2.2 Percentage days abstinent (PDA) | 2 | Mean Difference (IV, Random, 95% CI) | Subtotals only | |
| 2.2.1 3‐month follow‐up | 1 | 125 | Mean Difference (IV, Random, 95% CI) | ‐3.94 [‐14.73, 6.85] |
| 2.2.2 9‐month follow‐up | 1 | 93 | Mean Difference (IV, Random, 95% CI) | 3.00 [0.31, 5.69] |
| 2.3 Percentage days abstinent (PDA) | 1 | Other data | No numeric data | |
| 2.4 Drinks per drinking day (DDD) | 1 | Mean Difference (IV, Random, 95% CI) | Subtotals only | |
| 2.4.1 9‐month follow‐up | 1 | 93 | Mean Difference (IV, Random, 95% CI) | ‐1.76 [‐2.23, ‐1.29] |
| 2.5 Percentage days heavy drinking (PDHD) | 1 | Mean Difference (IV, Random, 95% CI) | Subtotals only | |
| 2.5.1 12‐month follow‐up | 1 | 286 | Mean Difference (IV, Random, 95% CI) | 2.09 [‐1.24, 5.42] |
Comparison 3. 2A Grouping: RCT/quasi‐RCT, all treatments manualized, compared to TSF variant.
| Outcome or subgroup title | No. of studies | No. of participants | Statistical method | Effect size |
|---|---|---|---|---|
| 3.1 Proportion of participants completely abstinent | 3 | Risk Ratio (M‐H, Random, 95% CI) | Subtotals only | |
| 3.1.1 6‐month follow‐up | 3 | 772 | Risk Ratio (M‐H, Random, 95% CI) | 1.07 [0.96, 1.18] |
| 3.1.2 12‐month follow‐up | 1 | 307 | Risk Ratio (M‐H, Random, 95% CI) | 1.28 [1.00, 1.63] |
| 3.2 Percentage days abstinent (PDA) | 2 | Mean Difference (IV, Random, 95% CI) | Subtotals only | |
| 3.2.1 6‐month follow‐up | 1 | 42 | Mean Difference (IV, Random, 95% CI) | ‐5.50 [‐25.35, 14.35] |
| 3.2.2 12‐month follow‐up | 1 | 95 | Mean Difference (IV, Random, 95% CI) | 16.40 [5.12, 27.68] |
| 3.3 Days of use (PDA) | 2 | Mean Difference (IV, Random, 95% CI) | Subtotals only | |
| 3.3.1 6‐month follow‐up | 2 | 427 | Mean Difference (IV, Random, 95% CI) | ‐1.93 [‐4.55, 0.69] |
| 3.4 Drinks per drinking day (DDD) | 1 | Mean Difference (IV, Random, 95% CI) | Subtotals only | |
| 3.4.1 6‐month follow‐up | 1 | 42 | Mean Difference (IV, Random, 95% CI) | ‐4.10 [‐10.44, 2.24] |
| 3.5 Addiction Severity Index (ASI) | 2 | Mean Difference (IV, Random, 95% CI) | Subtotals only | |
| 3.5.1 6‐month follow‐up | 2 | 690 | Mean Difference (IV, Random, 95% CI) | 0.03 [‐0.07, 0.13] |
| 3.5.2 12‐month follow‐up | 1 | 307 | Mean Difference (IV, Random, 95% CI) | 0.08 [0.02, 0.15] |
| 3.6 European Addiction Severity Index (EuropASI) | 1 | Mean Difference (IV, Random, 95% CI) | Subtotals only | |
| 3.6.1 6‐month follow‐up | 1 | 113 | Mean Difference (IV, Random, 95% CI) | ‐0.07 [‐0.08, ‐0.06] |
Comparison 4. 2B Grouping: RCT/quasi‐RCT, 1 + treatments non‐manualized, compared to TSF variant.
| Outcome or subgroup title | No. of studies | No. of participants | Statistical method | Effect size |
|---|---|---|---|---|
| 4.1 Proportion of participants completely abstinent | 2 | Risk Ratio (M‐H, Random, 95% CI) | Subtotals only | |
| 4.1.1 3‐month follow‐up | 1 | 126 | Risk Ratio (M‐H, Random, 95% CI) | 1.16 [0.76, 1.79] |
| 4.1.2 12‐month follow‐up | 1 | 382 | Risk Ratio (M‐H, Random, 95% CI) | 1.15 [1.02, 1.29] |
Comparison 5. 3B: Non‐randomized, 1+ treatments non‐manualized, compared to different theoretical orientation.
| Outcome or subgroup title | No. of studies | No. of participants | Statistical method | Effect size |
|---|---|---|---|---|
| 5.1 Proportion of participants completely abstinent | 3 | Risk Ratio (M‐H, Random, 95% CI) | Subtotals only | |
| 5.1.1 6‐month follow‐up | 1 | 314 | Risk Ratio (M‐H, Random, 95% CI) | 1.50 [1.16, 1.92] |
| 5.1.2 12‐month follow‐up | 2 | 2692 | Risk Ratio (M‐H, Random, 95% CI) | 1.25 [1.09, 1.43] |
| 5.1.3 24‐month follow‐up | 1 | 1774 | Risk Ratio (M‐H, Random, 95% CI) | 1.34 [1.20, 1.49] |
| 5.2 Drinks per drinking day (DDD) | 1 | Mean Difference (IV, Random, 95% CI) | Subtotals only | |
| 5.2.1 36‐month follow‐up | 1 | 201 | Mean Difference (IV, Random, 95% CI) | 0.00 [‐3.38, 3.38] |
| 5.3 Alcohol‐related consequences (SIP) | 1 | Mean Difference (IV, Random, 95% CI) | Subtotals only | |
| 5.3.1 12‐month follow‐up | 1 | 647 | Mean Difference (IV, Random, 95% CI) | ‐0.71 [‐1.68, 0.27] |
| 5.4 Alcohol‐related consequences | 1 | Mean Difference (IV, Random, 95% CI) | Subtotals only | |
| 5.4.1 36‐month follow‐up | 1 | 201 | Mean Difference (IV, Random, 95% CI) | 0.20 [‐1.34, 1.74] |
| 5.5 Alcohol addiction severity (Alcohol Dependence Scale) | 1 | Mean Difference (IV, Random, 95% CI) | Subtotals only | |
| 5.5.1 36‐month follow‐up | 1 | 201 | Mean Difference (IV, Random, 95% CI) | ‐0.30 [‐2.20, 1.60] |
Comparison 6. 4B: Non‐randomized, 1+ treatments non‐manualized, compared to TSF variant.
| Outcome or subgroup title | No. of studies | No. of participants | Statistical method | Effect size |
|---|---|---|---|---|
| 6.1 Proportion completely abstinent | 2 | Risk Ratio (M‐H, Random, 95% CI) | Subtotals only | |
| 6.1.1 6‐month follow‐up | 1 | 140 | Risk Ratio (M‐H, Random, 95% CI) | 1.01 [0.86, 1.19] |
| 6.1.2 12‐month follow‐up | 1 | 1870 | Risk Ratio (M‐H, Random, 95% CI) | 1.24 [1.05, 1.46] |
| 6.2 Percentage days abstinent (PDA) | 1 | Mean Difference (IV, Random, 95% CI) | Subtotals only | |
| 6.2.1 6‐month follow‐up | 1 | 140 | Mean Difference (IV, Random, 95% CI) | ‐0.01 [‐7.14, 7.12] |
| 6.3 Drinks per drinking day (DDD) | 1 | Other data | No numeric data | |
| 6.4 Addition Severity Index‐Lite (ASI‐L) | 1 | Mean Difference (IV, Random, 95% CI) | Subtotals only | |
| 6.4.1 6‐month follow‐up | 1 | 140 | Mean Difference (IV, Random, 95% CI) | 0.01 [‐0.05, 0.07] |
Characteristics of studies
Characteristics of included studies [ordered by study ID]
Blondell 2001.
| Study characteristics | ||
| Methods |
Design: prospective, non‐randomized study comparing usual physician care to a brief intervention and a peer intervention for patients with alcohol use disorder who were admitted to an urban teaching hospital with alcohol‐related injuries. Participants in the usual physician care intervention did not receive an addiction medicine consultation because the consultant was not available to see them. Recruitment and setting: participants recruited from an urban teaching hospital Fidelity assessment of intervention implementation: 0 (non‐manualized) |
|
| Participants | N = 314 participants (of whom 140 provided valid responses) who were participants with alcohol‐related injuries and alcohol use disorder. Age: age range for the 314 participants in the sample was 18‐80 years (mean 37.2, SD 12.5). Mean age of participants for whom follow‐up data were available was 38.1 years (SD 12.8). Gender: N = 258 (82.2%) males, 56 (17.8%) females. Follow‐up data available for 42.2% of men and 55.4% of women (P = 0.051). Ethnicity: N = 244 (77.7%) white participants, 70 (82.3%) non‐white participants. Follow‐up data available for 49.2% white participants and 28.6% non‐white participants (P = 0.003). |
|
| Interventions |
Peer intervention (NM) (n = 70): participants received a brief intervention plus a 30‐60 minute visit from a peer who was in recovery and active in AA. Participants had to agree to a peer visit. Brief intervention (M) (n = 119): participants received services from the addiction medicine consultant and were given brief advice (5‐15 minutes) in accordance with procedures outlined in Dunn 1997, which includes giving client feedback, stressing the participant's responsibility for change, providing advice, offering choices, listening with empathy and informing the participant that change is possible and beneficial. The delivery of these six components depends on the participant's stage of change (Dunn 1997). Usual physician care (NM) (n = 125): participants received trauma services but did not receive addiction medicine consultation because the consultant was not available to see them. Doctors and social workers may or may not have addressed participants' substance use before discharge. |
|
| Outcomes |
Follow‐up assessment points: baseline and 6 months post‐discharge (with 6‐month follow‐up data collected up to 12 months post‐discharge) Abstinence: complete abstinence from alcohol use during the entire 6 months post‐discharge, abstinent from alcohol use during the sixth‐month (i.e. the past month at the 6‐month follow‐up assessment) post‐discharge. |
|
| Notes |
Funding source: funded in part by University of Louisville Summer Research Scholarship Program and the University of Louisville Hospital Trauma Institute Declaration of Interest: none disclosed |
|
| Risk of bias | ||
| Bias | Authors' judgement | Support for judgement |
| Random sequence generation (selection bias) | High risk | Prospective, non‐randomized, design |
| Allocation concealment (selection bias) | High risk | Risk is high due to the study being non‐randomized |
| Blinding of participants and personnel (performance bias) All outcomes | Unclear risk | This is a subjective outcome, likely to be influenced by knowledge of the intervention. However, we could find no information in the report that the participants in this study had no knowledge of the different interventions. |
| Incomplete outcome data (attrition bias) All outcomes | High risk | Attrition rates were high across interventions ‐ peer intervention: 44%; brief intervention: 52%; usual care: 65%, but no statistical test was conducted to determine whether these rates differed significantly by study group. |
| Selective reporting (reporting bias) | Low risk | Expected outcomes are reported |
| Comparability of cohorts for baseline characteristics and outcome measures | High risk | No matching or no adjustment for most important confounding fact (more males in the peer intervention) |
| Selection of the non‐exposed cohort | Low risk | Non‐exposed cohort drawn from the same sample origin |
| Protection against contamination | Low risk | Unlikely that the control group received the intervention (individual intervention provided in private room) |
| Blinding of outcome assessment (detection bias) All outcomes | Unclear risk | Insufficient information to make judgment of high or low risk |
Blondell 2011.
| Study characteristics | ||
| Methods |
Design: RCT. Participants undergoing detoxification were randomly assigned to receive either TAU, a peer‐delivered TSF (P‐TSF) intervention, or a MET intervention. Recruitment and setting: participants were recruited from an inpatient alcohol and drug detox unit at a teaching hospital. Fidelity assessment of intervention implementation: 0 (non‐manualized) |
|
| Participants | N = 150 participants with alcohol dependence (DSM‐IV criteria) who had been hospitalized for medical management of alcohol detox. Age: the mean age of participants was 46.58 (SD 9.92), 44.96 (SD 10.75), 44.48 (SD 12.36) years in the TAU (n = 50), MET (N = 50), and P‐TSF (N = 50) groups, respectively (P = 0.61) Gender: there were 30 (60%), 35 (70%) and 33 (66%) men in the TAU, MET, and P‐TSF groups, respectively (P = 0.57). Ethnicity: there were 44 (88%), 39 (78%) and 43 (86%) white participants in the TAU, MET, and P‐TSF groups, respectively (P = 0.35). |
|
| Interventions |
P‐TSF (NM) (n = 39): intervention included TAU plus a 45 to 60‐minute visit by volunteers who were recovering from alcoholism MET (NM) (n = 41): intervention included TAU plus a 45 to 60‐minute motivational interview TAU (NM) (n = 42): included an initial medical evaluation, psychosocial assessments, and required group therapy sessions (1‐hour sessions, twice per day). Individual and family counseling, as well as self‐help groups were available but not required. A benzodiazepine and other medications were administered for detox as needed. |
|
| Outcomes |
Follow‐up assessment points: baseline and 7, 30 and 90 days post‐discharge Abstinence: PDA measured using TLFB, total 90‐day abstinence |
|
| Notes |
Funding source: NIAAA grant (K23‐AA015616) and grant from University of Bufffalo Interdisciplinary Research Fund Declaration of interest: none disclosed |
|
| Risk of bias | ||
| Bias | Authors' judgement | Support for judgement |
| Random sequence generation (selection bias) | Low risk | Researchers used block randomization |
| Allocation concealment (selection bias) | Low risk | Researchers enrolling participants could not foresee assignment. One of the investigators assigned the participants to one of three intervention arms using a 2:2:2 block randomization procedure. The same investigator also arranged for and coordinated the delivery of the interventions. The other investigators, the participants, and the other clinical staff, were not informed of the treatment (i.e. were masked). |
| Blinding of participants and personnel (performance bias) All outcomes | High risk | This is a subjective outcome, likely to be influenced by knowledge of the intervention. In the report, sufficient details were provided that participants could be aware of the different interventions ‐ (quote, page 3): "The other investigators, the participants, and the clinical staff members were not informed (i.e. were "masked") of the treatment condition; however participants often revealed their intervention assignment to the research assistants at the time of follow‐up data collection." |
| Incomplete outcome data (attrition bias) All outcomes | Unclear risk | Attrition was generally quite low across study interventions (TAU = 16%; MET = 18%; PTSF = 22) but statistical significance of these differences were not reported. |
| Selective reporting (reporting bias) | Low risk | Expected outcomes are reported |
| Comparability of cohorts for baseline characteristics and outcome measures | Low risk | RCT; authors demonstrated balance between groups for the confounders |
| Selection of the non‐exposed cohort | Low risk | Non‐exposed cohort drawn from the same sample origin |
| Protection against contamination | Low risk | Unlikely that the control group received the intervention |
| Blinding of outcome assessment (detection bias) All outcomes | Unclear risk | Insufficient information to make judgment of high or low risk |
Bogenschutz 2014.
| Study characteristics | ||
| Methods |
Design: RCT. Participants were randomized in a 2:1 (intervention: control) ratio to receive 12 weeks of either modified TSF or TAU using an urn randomization procedure which contained nine variables. Recruitment and setting: participants were recruited between April 2006 and June 2010 from the University of New Mexico Hospitals Psychiatric Center dual diagnosis program. Fidelity assessment of intervention implementation: 2 (report of attempts to ensure adherence/competence with audio or videotape monitoring and rating) |
|
| Participants | N = 121 participants with alcohol abuse or dependence (DSM‐IV criteria) and serious mental illness who were outpatients in a dual diagnosis treatment program. Age: the mean age of participants was 41.09 (SD 8.60) years in the TAU (n = 38) and 42.74 (SD 9.42) years in the TSF groups (n = 83). Gender: there were 20 men (54.1%) in the TAU group and 14 (51.9%) in the TSF group. Ethnicity: there were 17 (45.9%) non‐Hispanic white, 16 (43.2%) Hispanic, and 4 (10.8%) other participants in the TAU group, and 38 (48.7%) non‐Hispanic white, 29 (37.2%) Hispanic, and 11 (14.1%) other participants in the TSF group. |
|
| Interventions |
TSF (M) (n = 83): adapted from the Project MATCH TSF manual for use with participants with serious mental illness and alcohol use disorders TAU (NM) (n = 38): included individual treatment, psychiatric treatment and medication management, as well as case management on an as‐needed basis |
|
| Outcomes |
Follow‐up assessment points: baseline, 4 weeks (mid‐treatment), 8 weeks (mid‐treatment), 12 weeks (end of treatment), and 3, 6, and 9 months post‐treatment Abstinence: PDA and complete abstinence from alcohol during the assessment period (Y/N) measured using Form‐90‐A/TLFB. Blood alcohol concentration and urine drug screens also obtained at each visit. Drinking intensity: drinks per drinking day measured using Form‐90A. |
|
| Notes |
Funding source: NIAAA grants R01‐AA015419, K24‐AA016555, and T32‐AA18108 Declaration of interest: none disclosed |
|
| Risk of bias | ||
| Bias | Authors' judgement | Support for judgement |
| Random sequence generation (selection bias) | Low risk | Researchers used a computerized urn randomization procedure |
| Allocation concealment (selection bias) | Low risk | Researchers enrolling participants could not foresee assignment because a computerized urn randomization procedure was used. |
| Blinding of participants and personnel (performance bias) All outcomes | Unclear risk | This is a subjective outcome, likely to be influenced by knowledge of the intervention. However, we could find no information in the report that the participants in this study had no knowledge of the different interventions. |
| Incomplete outcome data (attrition bias) All outcomes | High risk | Overall attrition rate was moderately low ranging from 17% to 23% but details by treatment intervention were not reported for the longer‐term outcomes of interest. |
| Selective reporting (reporting bias) | Low risk | Expected outcomes are reported |
| Comparability of cohorts for baseline characteristics and outcome measures | Low risk | RCT; authors demonstrated balance between groups for the confounders |
| Selection of the non‐exposed cohort | Low risk | Non‐exposed cohort drawn from the same sample origin |
| Protection against contamination | Unclear risk | Unclear if communication between the intervention and comparison groups occurred |
| Blinding of outcome assessment (detection bias) All outcomes | Unclear risk | Insufficient information to make judgment of high or low risk |
Bowen 2014.
| Study characteristics | ||
| Methods |
Design: RCT. Participants who had completed initial substance use disorder treatment (intensive outpatient or inpatient care) were randomly assigned to received 8 weeks of either MBRP, RP, and TAU aftercare. Recruitment and setting: participants were recruited between October 2009 and July 2012 through research information sessions (hosted by research staff) and advertisements at the two‐site private, non‐profit treatment facility where the research took place. Fidelity assessment of intervention implementation: 2* (report of attempts to ensure adherence/competence with audio or videotape monitoring and rating; *no report of supervision for TAU intervention) |
|
| Participants | N = 286 participants with substance use disorder; 72.3% with alcohol use disorder Age: the mean age was 37.2 (SD 10.8), 38.9 (SD 10.9), and 39.1 (SD 10.9) years in the TAU, RP, and MBRP groups, respectively. Gender: 72.6% (n = 69) of the TAU group, 63.6% (n = 56) of the RP group, and 73.8% (n = 76) of the MBRP group were male. Ethnicity: participants in the TAU group were 48.4% non‐Hispanic white, 23.2% black or African American, 13.7% Hispanic or Latino/Latina, 4.2% Native American, 1.1% Asian, 1.1% Native Hawaiian/Pacific Islander, 9.5% mixed, and 2.1% other/not specified. Participants in the RP group were 48.9% non‐Hispanic white, 14.8% black or African American, 11.4% Hispanic or Latino/Latina, 9.1% Native American, 0% Asian, 1.1% Native Hawaiian/Pacific Islander, 13.6% mixed, and 3.4% other/not specified. Participants in the MBRP group were 55.3% non‐Hispanic white, 25.2% black or African American, 8.7% Hispanic or Latino/Latina, 5.8% Native American, 1.0% Asian, 0% Native Hawaiian/Pacific Islander, 5.8% mixed, and 0 % other/not specified. |
|
| Interventions |
MBRP (M) (n = 103): consisted of 8 weekly, 2‐hour groups, each with a central theme and focusing on awareness of physical, emotional and cognitive phenomena, as well as mindfulness practices, social support, and self‐care, among other topics. Each group included a 20‐30 minute guided meditation, and participants also received mindfulness exercises for homework and tracked their daily cravings and moods. RP (M) (n = 88): consisted of 8 weekly, 2‐hour groups which focused on identifying and problem‐solving high risk situations, cognitive and behavioral coping skills, goal setting, social support and self‐efficacy. Participants also received homework and tracked their daily cravings and moods. TAU (NM) (n = 95): consisted of weekly groups that met 1‐2 times per week for 1.5 hours and that were abstinence‐based, based on the AA/NA 12‐step program, and primarily process oriented. |
|
| Outcomes |
Follow‐up assessment points: participants completed baseline and 3‐, 6‐ and 12‐month follow‐ups Drinking intensity: percentage days heavy drinking |
|
| Notes |
Funding source: NIH/NIDA grants sponsored project (participant payments, partial support for Drs Bowen, Witkiewitz, Clifasefi, Grow, Chawla, Collins, and Larimer, and all costs associated with conducting the study). NIH supplemental grants provided partial support for some researchers (Dr Lustyk and Ms Carrol). NIH/NIAAA F31 fellowship supported Ms Hsu, Recovery Centers of King County sponsored project research effort with a consortium agreement, partially supporting salary of Ms Harrop. Declaration of interest: Drs Bowen, Grow, and Chawla conduct MBRP training for which they receive monetary incentives. No other disclosures were reported |
|
| Risk of bias | ||
| Bias | Authors' judgement | Support for judgement |
| Random sequence generation (selection bias) | Unclear risk | Participants were reported as being randomly assigned to receive either the intervention or comparison treatment but no other details provided. |
| Allocation concealment (selection bias) | Unclear risk | No details on randomization procedures provided. |
| Blinding of participants and personnel (performance bias) All outcomes | Unclear risk | This is a subjective outcome, likely to be influenced by knowledge of the intervention. However, we could find no information in the report that the participants in this study had no knowledge of the different interventions. |
| Incomplete outcome data (attrition bias) All outcomes | Low risk | Follow‐up rates were at least 80% and did not differ significantly across treatment interventions (TAU = 20%; RP = 18%; MBRP = 19%; P > 0.05). |
| Selective reporting (reporting bias) | Low risk | Expected outcomes are reported. |
| Comparability of cohorts for baseline characteristics and outcome measures | Low risk | RCT; analyses are adjusted for most important confounding factors and imbalance |
| Selection of the non‐exposed cohort | Low risk | Non‐exposed cohort drawn from the same sample origin |
| Protection against contamination | Unclear risk | Unclear if communication between the intervention and comparison groups occurred |
| Blinding of outcome assessment (detection bias) All outcomes | Unclear risk | Insufficient information to make judgment of high or low risk |
Brooks 2003.
| Study characteristics | ||
| Methods |
Design: quasi‐RCT. Participants were alternately assigned to a 12‐step or cognitive behavioral (SMART) group, both of which consisted of five hours of treatment, five days a week, for six months. Recruitment and setting: participants were recruited from an intensive outpatient/partial hospitalization program Fidelity assessment of intervention implementation: 1 (report of attempts to ensure adherence/competence without audio or videotape) |
|
| Participants | N = 112 participants with a dual diagnosis of substance abuse or dependence (DSM III‐R criteria) and serious mental illness who were in an intensive outpatient/partial hospitalization program Age: the mean sample age was 34.2 (SD 8.8) years. The mean age in the 12‐step group was 34.3 (SD 9.3) years and 34.2 (SD 8.4) years in the SMART group. Gender: 42% of the sample was female, and 51.9% of the 12‐step group and 32.8% of the SMART group were female. Ethnicity: 69.6% of the sample was white, and 66.7% of the 12‐step group and 72.4% of the SMART group was white. |
|
| Interventions | Group counselors for both groups focused on the same weekly topics (e.g. RP, mental illness management, etc.) but the material used to cover the topics reflected each group's philosophy. 12‐step (M) (n = 54): incorporated the 12‐step, disease model, and 12 traditions SMART (M) (n = 58) (cognitive behavioral): followed the national organization's guidelines and techniques |
|
| Outcomes |
Follow‐up assessment points: baseline, during treatment (at 3 and 6 months), and 3 and 12 months post‐treatment. Alcohol addiction severity: addiction severity index (ASI; alcohol, drug, psychiatric, medical, legal, employment). Urinalysis for alcohol and drug use at baseline, 2 months, 4 months, 9 months, and 12 months |
|
| Notes |
Funding source: NIDA grant (R01‐DA09531) and La Frontera Center, Inc. Declaration of interest: none disclosed |
|
| Risk of bias | ||
| Bias | Authors' judgement | Support for judgement |
| Random sequence generation (selection bias) | High risk | Researchers use alternation as a non‐random component in the sequence generation process |
| Allocation concealment (selection bias) | High risk | Researchers enrolling participants could possibly foresee assignment (alternation) |
| Blinding of participants and personnel (performance bias) All outcomes | Unclear risk | This is a subjective outcome, likely to be influenced by knowledge of the intervention. However, we could find no information in the report that the participants in this study had no knowledge of the different interventions. |
| Incomplete outcome data (attrition bias) All outcomes | Unclear risk | Not reported |
| Selective reporting (reporting bias) | Low risk | Expected outcomes are reported |
| Comparability of cohorts for baseline characteristics and outcome measures | Low risk | Analyses are adjusted for most important confounding factors and imbalance (controlled for gender in the hierarchical linear model) |
| Selection of the non‐exposed cohort | Low risk | Non‐exposed cohort drawn from the same sample origin |
| Protection against contamination | Low risk | Unlikely that the control group received the intervention (groups held at separate sites) |
| Blinding of outcome assessment (detection bias) All outcomes | Unclear risk | Insufficient information to make judgment of high or low risk |
Brown 2002.
| Study characteristics | ||
| Methods |
Design: RCT. Using an urn randomization procedure which contained seven variables, participants were randomly assigned to receive ten, 90‐minute, weekly aftercare sessions of either structured RP or TSF. Recruitment and setting: participants were recruited from three residential substance use treatment programs in Montreal. Participants were recruited within two days of admission to intensive treatment, at which point they consented to accept randomization and were then randomized into one of two aftercare sessions after completing intensive treatment. Fidelity assessment of intervention implementation: 1 (report of attempts to ensure adherence/competence without audio or videotape) |
|
| Participants | 336 participants with alcohol abuse or dependence (DSM‐III criteria) agreed to participate. 266 participants were randomized into two groups (TSF or RP group) and 70 participants refused randomization but agreed to complete follow‐up assessments (UC group). 151 participants were followed up, including 61 RP participants, 70 TSF participants, and 20 UC participants. Age: the mean sample age was 38.0 (SD 9.3) years. (Note: mean age did not account for 20 participants in the UC group) Gender: 31.3% (41 participants) of the sample were female. (Note: gender breakdown did not account for 20 participants in the UC group) Ethnicity: 92.5% (123 participants) of the sample were white. (Note: ethnic breakdown did not account for 20 participants in the UC group) |
|
| Interventions |
TSF (M) (n = 140): based on the TSF manual developed by the Project MATCH Research Group, and emphasized steps 1 through to 3, though all 12 steps were explored in the group. RP (M) (n = 126): included 10 weekly sessions of a manualized treatment process consisting of three counseling stages, which includes: administering questionnaires to assess for high‐risk substance use situations (first stage), counseling that focuses on change initiation (second stage), and counseling that focuses on the maintenance of change (third stage). UC (M) (n= 70): included participants who were not willing to be randomized but consented to complete the four assessment sessions and attend the usual aftercare programs that their treatment center offered. |
|
| Outcomes |
Follow‐up assessment points: data were collected at intake into intensive treatment, following the completion of intensive treatment, upon completion of the aftercare program, and 6 months after completing the intensive treatment. Substance use outcomes were assessed at 3 and 6 months post‐treatment. Alcohol addiction severity: alcohol and drug use addiction severity (measured using the ASI) |
|
| Notes |
Funding source: The National Health and Research Development Program of Health Canada and the Career Awards program of Quebec Council of Psychosocial Research Declaration of interest: none disclosed |
|
| Risk of bias | ||
| Bias | Authors' judgement | Support for judgement |
| Random sequence generation (selection bias) | Low risk | Researchers used an urn randomization procedure |
| Allocation concealment (selection bias) | Low risk | Researchers enrolling participants could not foresee assignment because a computerized urn randomization procedure was used. |
| Blinding of participants and personnel (performance bias) All outcomes | Unclear risk | This is a subjective outcome, likely to be influenced by knowledge of the intervention. However, we could find no information in the report that the participants in this study had no knowledge of the different interventions. |
| Incomplete outcome data (attrition bias) All outcomes | Unclear risk | Not enough information provided to permit judgment of low or high risk |
| Selective reporting (reporting bias) | Low risk | Expected outcomes are reported |
| Comparability of cohorts for baseline characteristics and outcome measures | Low risk | RCT; authors demonstrated balance between groups for the confounders |
| Selection of the non‐exposed cohort | Low risk | Non‐exposed cohort drawn from the same sample origin |
| Protection against contamination | Unclear risk | Unclear if communication between the intervention and comparison groups occurred |
| Blinding of outcome assessment (detection bias) All outcomes | Unclear risk | Insufficient information to make judgment of high or low risk |
Davis 2002.
| Study characteristics | ||
| Methods |
Design: RCT. Participants randomly assigned to receive six months of either the standard outpatient treatment or minimal treatment. Recruitment and setting: participants who applied at the Bronx VA to attend an outpatient alcohol program (without having gone through an inpatient program first) were recruited to participate between April 1985 and April 1987. Fidelity assessment of intervention implementation: 0 (no report of attempts to ensure adherence/competence of intervention implementation) |
|
| Participants | 89 participants with alcohol abuse or dependence (DSM‐III criteria). 105 participants originally randomized; however, 3 ST and 13 MT participants were withdrawn from the study. Age: participants ranged in age from 29 to 65 years. The mean age was 48.1 (SD 10.5) years in the ST group (n = 49) and 45.5 (SD 8.25) years in the MT group (n = 40). Gender: study sample consisted of men only Ethnicity: in the ST group, 46.9%, 26.5% and 26.5% of participants were black, white and Hispanic, respectively. In the MT group, 45.0, 15.0% and 40.0% of participants were black, white and Hispanic, respectively. |
|
| Interventions |
ST (M) (n = 49): participants received group therapy (6 sessions) and participated in alcohol education sessions during which movies were shown (3 sessions), community meetings (3), leisure education sessions (3). Participants attended a minimum of six AA meetings. MT (M) (n = 40): participants watched an alcoholism education movie once a week with no discussion afterward, with the exception of once a month when a therapist led the movie discussion and collected information about participants' sobriety. Note: participants in both interventions evaluated monthly by medical provider who performed a breathalyzer test. |
|
| Outcomes |
Follow‐up assessment points: baseline and 6‐month follow‐up (from both the participant and a collateral), as well as during monthly doctor visits during treatment which included breathalyzer tests Abstinence: complete abstinence, number of days drinking (from which derived PDA), longest period of abstinence |
|
| Notes |
Funding source: not reported Declaration of Interest: none disclosed |
|
| Risk of bias | ||
| Bias | Authors' judgement | Support for judgement |
| Random sequence generation (selection bias) | Unclear risk | Participants randomly assigned to receive either the intervention or comparison treatment but no other details are provided. |
| Allocation concealment (selection bias) | Unclear risk | Insufficient details provided in order to make a proper judgment about this type of bias. |
| Blinding of participants and personnel (performance bias) All outcomes | High risk | This is a subjective outcome, likely to be influenced by knowledge of the intervention. In the report, sufficient details were provided that participants could be aware of the different interventions: (quote, page 18) "Neither patients, nor the personnel collecting the follow‐up data were blind to the treatment condition." |
| Incomplete outcome data (attrition bias) All outcomes | High risk | Missing outcome data rates were ST = 23%, MT = 38% but no significance test was provided. |
| Selective reporting (reporting bias) | Low risk | Expected outcomes are reported |
| Comparability of cohorts for baseline characteristics and outcome measures | Low risk | RCT; authors demonstrated balance between groups for the confounders |
| Selection of the non‐exposed cohort | Low risk | Non‐exposed cohort drawn from the same sample origin |
| Protection against contamination | Unclear risk | Unclear if communication between the intervention and comparison groups occurred |
| Blinding of outcome assessment (detection bias) All outcomes | High risk | No blinding of outcome assessment (some assessments completed by therapist and treating doctor), and the outcome measurement is likely to be influenced by lack of blinding |
Grant 2018.
| Study characteristics | ||
| Methods |
Design: non‐randomized, pretest to post‐test design. Participants entering substance use treatment were assigned a therapist who provided either a standard referral (SR) or rural‐adapted intensive referral (RAIR) to mutual‐help groups (MHGs). Recruitment and setting: participants were recruited from three VA intensive substance use disorder treatment programs in the Midwest. Fidelity assessment of intervention implementation: 0 (no report of attempts to ensure adherence/competence of intervention implementation) |
|
| Participants | 195 participants in substance use disorder treatment at one of three VA treatment programs Age: the mean sample age was 46.86 (SD 12.25) years. The mean age in the SR (n = 89) group was 46.37 (n = 12.64) years and 47.26 (SD 11.96) years in the RAIR (n = 106) group. Gender: 91.3% (n = 178) of the sample were male. 93.3% (n = 83) of the SR group and 89.6% (n = 95) of the RAIR group were male. Ethnicity: there were 150 (76.9%) Caucasian (understood to be white) and 11 (5.6%) Hispanic participants in the sample. There were 69 (77.5%) Caucasian and 7 Hispanic (7.9%) participants in the SR group, and 81 (76.4%) Caucasian and 4 (3.8%) Hispanic participants in the RAIR group. |
|
| Interventions |
RAIR (M) (n = 106): modified intensive referral intervention consisting of three sessions wherein a MHG and "recovery buddy" are identified in the participant's home community, and family members are educated about the importance of MHGs. Participants also schedule a MHG meeting to attend (session 1) and follow‐up about their MHG attendance (sessions 2 and 3). SR (NM) (n = 89): standard intensive referral to MHGs, which may include relying on the same MHG "buddy" during and after treatment. intervention based on intensive referral used in Timko 2007, which included counselor giving participants an AA/NA schedule, materials about 12‐step philosophy, arranging a meeting between the participant and an existing AA/NA member, agreeing on meeting to attend, and following up with participants in future sessions. |
|
| Outcomes |
Follow‐up assessment points: baseline and 6‐month follow‐up
Abstinence: PDA from alcohol, cannabis, methamphetamine, and cocaine (measured using the TLFB), complete abstinence Drinking intensity: use per using day for each substance, including drinks per drinking day (DDD; measured using the TLFB) Alcohol addiction severity: ASI‐L to measure severity of alcohol (ASI‐alcohol) and drug (ASI‐drug) use |
|
| Notes |
Funding source: Department of Veterans Affairs, Veterans Health Administration, Office of Research and Development, Health Services Research and Development (RCS 00‐001), the VA Office of Rural Health Midwest Rural Health Resource Center; The Department of Veterans Affairs Substance Use Disorders Quality Enhancement Research Initiative; and the Department of Veterans Affairs Health Services Research and Development Service Quality Enhancement Research Initiative Declaration of interest: none disclosed |
|
| Risk of bias | ||
| Bias | Authors' judgement | Support for judgement |
| Random sequence generation (selection bias) | High risk | Participants were not randomized. Participants entering substance use treatment were "assigned a therapist" but this was not random. The therapist provided either a SR or RAIR to MHGs. |
| Allocation concealment (selection bias) | High risk | Risk is high due to the study being non‐randomized. |
| Blinding of participants and personnel (performance bias) All outcomes | Unclear risk | This is a subjective outcome, likely to be influenced by knowledge of the intervention. However, we could find no information in the report that the participants in this study had no knowledge of the different interventions. |
| Incomplete outcome data (attrition bias) All outcomes | High risk | Follow‐up attrition rate was moderately high (28%) but differential attrition by study intervention was not reported. |
| Selective reporting (reporting bias) | Low risk | Expected outcomes are reported |
| Comparability of cohorts for baseline characteristics and outcome measures | Low risk | Authors demonstrated balance between groups for the confounders |
| Selection of the non‐exposed cohort | Low risk | Non‐exposed cohort drawn from the same sample origin |
| Protection against contamination | Unclear risk | Unclear if communication between the intervention and comparison groups occurred |
| Blinding of outcome assessment (detection bias) All outcomes | Unclear risk | Insufficient information to make judgment of high or low risk |
Herman 2000.
| Study characteristics | ||
| Methods |
Design: RCT. Participants were randomly assigned (within gender and order of enrollment) using a 2:1 ratio to either the MHCD program or SWT. Recruitment and setting: participants were newly admitted patients recruited from a JCAHO‐accredited state psychiatric hospital in the Midwest. Fidelity assessment of intervention implementation: 0 (non‐manualized) |
|
| Participants | 485 participants who met criteria for mental illness and alcohol dependence (47.3%), alcohol abuse (26.1%), cocaine dependence (39.9%), cocaine abuse (20.3%), cannabis dependence (10.3%), and/or cannabis abuse (12.4%), based on a modified 28‐item version of the Michigan Alcoholism Test and clinical determination. 429 participants completed at least one post‐discharge interview. Age: the mean sample age was 33.2 (SD 7.2) years. (Note: mean age based on 429 participants who completed at least one post‐discharge interview) Gender: 317 participants (73.9%) were male. (Note: gender information based on 429 participants who completed at least one post‐discharge interview) Ethnicity: 99 participants (23.1%) were Caucasian (understood to be white) and 330 participants (76.9%) were African American. (Note: ethnicity information based on 429 participants who completed at least one post‐discharge interview) |
|
| Interventions |
MHCD (NM) (n = 307): specialized treatment based on a staged theoretical model in which patients participated in AA/NA groups, family education, and RP. Participants in the MHCD program were also required to attend two AA and/or NA meetings each week. SWT (NM) (n = 178): consisted of standard short‐term treatment that did not emphasize substance use treatment, though participants could elect to attend AA and/or NA. |
|
| Outcomes | Follow‐up assessment points: baseline, 4 weeks or hospital discharge (whichever occurred first), and 2, 6, 10, 14, and 18 months post‐discharge. Abstinence: number of days of alcohol in the month prior to each interview using the ASI | |
| Notes | Participant information also reported in Herman 1997 Funding source: National Institutes of Mental Health, Research in State Mental Health Agencies initiative (MH46307) Declaration of interest: none disclosed |
|
| Risk of bias | ||
| Bias | Authors' judgement | Support for judgement |
| Random sequence generation (selection bias) | Unclear risk | Participants randomly assigned to receive either the intervention or comparison treatment but no other details are provided |
| Allocation concealment (selection bias) | Unclear risk | No details on type of randomization procedure provided |
| Blinding of participants and personnel (performance bias) All outcomes | High risk | This is a subjective outcome, likely to be influenced by knowledge of the intervention. In the report, sufficient details were provided that participants could be aware of the different interventions: (quote, page 289) "During recruitment, both treatment programs were described to the person along with the purpose and procedures of the study." |
| Incomplete outcome data (attrition bias) All outcomes | Unclear risk | Not enough information provided to permit judgment of low or high risk |
| Selective reporting (reporting bias) | Low risk | Expected outcomes are reported |
| Comparability of cohorts for baseline characteristics and outcome measures | Unclear risk | Information about comparability of cohorts is unclear |
| Selection of the non‐exposed cohort | Low risk | Non‐exposed cohort drawn from the same sample origin |
| Protection against contamination | High risk | Although on different wards, both treatments were housed within the same residential treatment hospital and it is likely that participants would have had interactions during the course of their stay |
| Blinding of outcome assessment (detection bias) All outcomes | Unclear risk | Insufficient information to make judgment of high or low risk |
Humphreys 1996.
| Study characteristics | ||
| Methods |
Design: observational cohort study and economic evaluation. Participants initially selected either professional outpatient alcohol treatment or AA as their source of help for their alcohol problem. Recruitment and setting: participants recruited between January 1984 and December 1986 from detoxification units and alcoholism information and referral services in the San Francisco Bay area. Fidelity assessment of intervention implementation: 0 (non‐manualized) |
|
| Participants | 201 alcoholic participants who had no prior treatment for alcohol problems Age: the mean sample age was 35.3 (SD 8.8) years. The mean age in the AA (n = 135) group was 34.7 (n = 9.1) years and 36.4 (SD 8.2) years in the outpatient (n = 66) group. Gender: 102 participants (50.9%) were male. Ethnicity: 174 participants (86.6%) were Caucasian (understood to be white) |
|
| Interventions |
AA group (NM) (n = 135): participants chose AA as their only source of help Outpatient group (NM) (n = 66): participants chose to receive professional outpatient treatment from either a social worker, psychologist, psychiatrist, general medical practitioner, or outpatient alcoholism treatment clinic. |
|
| Outcomes |
Follow‐up assessment points: baseline, 1‐ and 3‐year follow‐ups. Abstinence: number of days intoxicated in the past month Drinking intensity: number of ounces of ethanol consumed on a typical drinking day in the past month (DDD and PDHD). Alcohol‐related consequences: adverse consequences scale score (measured using a 9‐item scale; information on adverse consequences also obtained from participants' collaterals) Alcohol addiction severity: Alcohol Dependence Scale score Economic savings; healthcare cost offsets: per person alcoholism treatment costs (based on 1994 dollars and calculated using a list of nationally representative costs for services) |
|
| Notes |
Funding source: NIAAA grants AA10652 to Dr Humphreys and AA02863 and AA06699 to Dr Moos and the Department of Veterans Affairs Health Services Research and Development Service and Mental Health and Behavioral Sciences Service Declaration of interest: none disclosed |
|
| Risk of bias | ||
| Bias | Authors' judgement | Support for judgement |
| Random sequence generation (selection bias) | High risk | Non‐random assignment of participants (observational cohort design) |
| Allocation concealment (selection bias) | High risk | Risk is high due to the study being non‐randomized. |
| Blinding of participants and personnel (performance bias) All outcomes | Unclear risk | This is a subjective outcome, likely to be influenced by knowledge of the intervention. However, we could find no information in the report that the participants in this study had no knowledge of the different interventions. |
| Incomplete outcome data (attrition bias) All outcomes | Unclear risk | Not enough information provided to permit judgment of low or high risk |
| Selective reporting (reporting bias) | Low risk | Expected outcomes are reported |
| Comparability of cohorts for baseline characteristics and outcome measures | High risk | No matching or no adjustment for most important confounding factor (AA group had a worse prognosis at baseline) |
| Selection of the non‐exposed cohort | Low risk | Non‐exposed cohort drawn from the same sample origin |
| Protection against contamination | High risk | It is likely that the control group received the intervention (some participants crossed interventions from their initial intervention) |
| Blinding of outcome assessment (detection bias) All outcomes | Unclear risk | Insufficient information to make judgment of high or low risk |
| Blinding of outcome assessment (detection bias) Cost‐effectiveness only | Unclear risk | Insufficient information to make judgment of high or low risk |
Kahler 2004.
| Study characteristics | ||
| Methods |
Design: RCT. Participants in inpatient detoxification were randomly assigned by 8‐person cohort to receive either BA to attend AA‐NA or an ME‐12 intervention designed to increase 12‐step attendance. Recruitment and setting: participants were recruited from an inpatient alcohol detoxification facility. At least 24 hours after the participant entered detox, research assistants explained study procedures and participants completed baseline (if they enrolled). Fidelity assessment of intervention implementation: 2 (report of attempts to ensure adherence/competence with audio or videotape monitoring and rating) |
|
| Participants | 48 participants with alcohol dependence who were patients in an inpatient alcohol detox facility Age: participants ranged in age from 18‐65 years, with a mean age of 42.0 (SD 7.8) years in the BA group, and 44.1 (SD 7.0) years in the ME‐12 group. Gender: 29.1% female in the BA group and 16.7% female in the ME‐12 group (P = 0.49). Ethnicity: 79.2% white, 16.6% African American, and 4.2% other in the BA group, and 83.3% white, 12.5% Hispanic‐Latino, and 4.2% other in the ME‐12 group (all non significant). |
|
| Interventions |
ME‐12 (M) (n = 24): participants received a manual‐guided 60‐minute intervention which included: a focus on increasing the participants' commitment to abstinence, discussion of the participants' goals for reducing alcohol use and how they plan to meet those goals, a brief explanation of AA‐NA and how to obtain a temporary sponsor, discussion of the positive and negative aspects of 12‐step groups, as well as discussion of the benefits of AA‐NA, among other components. BA (M) (n = 24): participants received a scripted, 5‐min session with a therapist who stressed that the participant had an alcohol problem and the importance of abstinence, and briefly described AA‐NA and its benefits. Therapists recommended the participant be as involved as possible in AA‐NA and gave the participant a meeting schedule. |
|
| Outcomes |
Follow‐up assessment points: baseline and 1‐, 3‐, and 6‐month follow‐ups, and significant other interviews (regarding participants' drinking) were conducted at 1‐, 3‐, and 6‐month follow‐ups. Abstinence: PDA, measured using TLFB Drinking intensity: average number of DDD measured using TLFB |
|
| Notes |
Funding source: not reported Declaration of interest: none disclosed |
|
| Risk of bias | ||
| Bias | Authors' judgement | Support for judgement |
| Random sequence generation (selection bias) | Low risk | Participants were randomized by cohort to avoid contamination across treatments. Eight cohorts of six participants was run with each cohort determined randomly. |
| Allocation concealment (selection bias) | Low risk | Researchers enrolling participants could not foresee assignment. Participants were randomized by cohort to avoid contamination across treatments. Eight cohorts of six participants was run with each cohort determined at random. |
| Blinding of participants and personnel (performance bias) All outcomes | Unclear risk | This is a subjective outcome, likely to be influenced by knowledge of the intervention. However, we could find no information in the report that the participants in this study had no knowledge of the different interventions. |
| Incomplete outcome data (attrition bias) All outcomes | Unclear risk | Missing outcome data were low at follow‐ups (10% to 15%) but no details on differential follow‐up by study intervention was reported. |
| Selective reporting (reporting bias) | Low risk | Expected outcomes are reported |
| Comparability of cohorts for baseline characteristics and outcome measures | Unclear risk | Information about comparability of cohort is unclear |
| Selection of the non‐exposed cohort | Low risk | Non‐exposed cohort drawn from the same sample origin |
| Protection against contamination | Low risk | Unlikely that the control group received the intervention (each cohort passed through before next one began) |
| Blinding of outcome assessment (detection bias) All outcomes | Unclear risk | Insufficient information to make judgment of high or low risk |
Kaskutas 2009b.
| Study characteristics | ||
| Methods |
Design: quasi‐RCT using an 'ON/OFF' design so that participants in the ON (i.e. intervention) intervention did not discuss MAAEZ content with those in the OFF (i.e. control) intervention. Treatment counselors first delivered the 'OFF' intervention (TAU) and then delivered the 'ON' intervention (MAAEZ) wherein six MAAEZ sessions replaced six usual care 12‐step education groups, and then participants returned to TAU. Recruitment and setting: participants recruited from 3 July 2005 to 5 May 2006 from two northern California treatment centers which, together, had day treatment (1 month), outpatient treatment (6 months), short‐term residential treatment (1 month), and long‐term residential treatment (1 program up to 9 months, the other up to 12 months) programs. Fidelity assessment of intervention implementation: 2 (report of attempts to ensure adherence/competence with audio or videotape monitoring and rating) |
|
| Participants | 508 participants who were in treatment for current drug or alcohol abuse or dependence (as determined by the Quick‐DIS; Diagnostic Interview Schedule Quick Form for Substance Abuse/ Dependence) Age: the sample was comprised of 30% 18‐20 year olds, 29.5% 30‐39 year olds, 32.4% 40‐49 year olds and 8.2% 50+ year olds in the long‐term residential program; 27.9% 18‐20 year olds, 29.4% 30‐39 year olds, 26.5% 40‐49 year olds and 16.2% 50+ year olds in the short‐term residential program, and 34.2% 18‐20 year olds, 29.8% 30‐39 year olds, 26.1% 40‐49 year olds and 9.9% 50+ year olds in the outpatient program. Gender: participants were 67.8% male and 32.2% female in the long‐term residential program, 74.3% male and 25.7% female in the short‐term residential program, and 59% male and 41.0% female in the outpatient programs. Ethnicity: participants were 41.2% white, 26.1% black, 24.6% Hispanic, and 8.1% other in the long‐term residential program; 63.2% white, 19.9% black, 10.3% Hispanic, 6.6% other in the short‐term residential program, and 56.5% white, 10.6% black, 26.7% Hispanic, and 6.2% other in the outpatient program. |
|
| Interventions |
MAAEZ (M) (n = 312): a manual‐guided intervention designed to help individuals overcome their resistance to 12‐step groups by helping them change their attitudes towards, and connect with, people who they would encounter in AA. Treatment as usual (NM) (n = 196): included an introduction to the 12 steps of AA/NA/CA, addiction education, RP, stress and anger management, as well as process groups and family education. |
|
| Outcomes |
Follow‐up assessment points: baseline, 6‐ and 12‐month follow‐ups. Abstinence: last 30‐day abstinence status (dichotomous Y/N variable derived from ASI questions on past 30‐day alcohol and drug use). |
|
| Notes |
Funding source: NIAAA grant (R01‐AA14688) Declaration of interest: none disclosed |
|
| Risk of bias | ||
| Bias | Authors' judgement | Support for judgement |
| Random sequence generation (selection bias) | High risk | Researchers use alternation as a non‐random component in the sequence generation process |
| Allocation concealment (selection bias) | High risk | Researchers enrolling participants could possibly foresee assignment (alternation) |
| Blinding of participants and personnel (performance bias) All outcomes | Low risk | This is a subjective outcome, likely to be influenced by knowledge of the intervention. However, we believe it is unlikely that participants in this study had knowledge of the two different interventions because a sequential ON/OFF design was used to expressly avoid this. |
| Incomplete outcome data (attrition bias) All outcomes | High risk | Lost to follow‐up rates overall were moderate (25%), but no details of differential follow‐up rates by study intervention were reported. |
| Selective reporting (reporting bias) | Low risk | Expected outcomes are reported |
| Comparability of cohorts for baseline characteristics and outcome measures | Unclear risk | Information about comparability of cohort by intervention group not provided |
| Selection of the non‐exposed cohort | Low risk | Non‐exposed cohort drawn from the same sample origin |
| Protection against contamination | Low risk | Unlikely that the control group received the intervention (ON‐OFF design) |
| Blinding of outcome assessment (detection bias) All outcomes | Unclear risk | Insufficient information to make judgment of high or low risk |
Kelly 2017b.
| Study characteristics | ||
| Methods |
Design: RCT. Participants randomly assigned to receive 10 sessions of either the iTSF or MET/CBT group. Data collected at baseline, 3, 6, and 9 months after treatment entry. Recruitment and setting: participants were recruited between July 2013 and February 2014 from a variety of sources, including: through community advertisements, schools, local treatment programs, and probation offices/drug courts. The study site was the Center for Addiction Medicine at Massachusetts General Hospital in Boston, MA. Fidelity assessment of intervention implementation: 2 (report of attempts to ensure adherence/competence with audio or videotape monitoring and rating) |
|
| Participants | 59 adolescents with alcohol/drug abuse or dependence (DSM‐IV‐TR criteria) Age: the mean sample age was 16.8 (SD 1.7) years and the sample age range was 14 to 21 years. The mean age in the MET/CBT group was 16.9 (SD 2.0) years and 16.8 (SD 1.6) years in the iTSF group. Gender: the sample was 73% male, 27% female. The MET/CBT group was 73.3% male (n = 22) and 26.7% female (n = 8), and the iTSF group was 72.4% (n = 21) male and 27.6% female (n = 8). Ethnicity: the sample was 78% non‐Hispanic white. The MET/CBT group was 10.7% African American, 7.1% Asian/Pacific Islander, 67.9% white, and 14.3% reported more than one race. The iTSF group was 7.1% African American, 3.6% Asian/Pacific Islander, 82.1% white, and 7.1% reported more than one race. |
|
| Interventions |
iTSF (M) (n = 29): included 1 individual session (60‐75 minutes) followed by 8 weekly sessions (90 minutes) with an individual booster session prior to the fifth group session (30‐50 minutes). Six iTSF groups were based around recovery‐related topics (e.g. 12‐step attendance, reducing relapse risk, changing social networks), and in the two other groups members of 12‐Step organizations (i.e. MA or NA) were invited to the group to share their experiences with participants. MET/CBT (M) (n = 30): included 2 consecutive individual MET sessions (60 minutes each) followed by 8 weekly group CBT sessions (90‐minutes each). CBT groups focused on teaching and practicing a CBT skill (e.g. coping with urges) and participants were assigned topic‐related homework after each group. |
|
| Outcomes |
Follow‐up assessment points: baseline and 3, 6, 9 months after treatment entry Abstinence: PDA from any drugs or alcohol (excluding nicotine) measured using TLFB; longest period of abstinence (derived from TLFB and Form‐90); abstinent/mostly abstinent as a dichotomous variable (Y/N) Alcohol‐related consequences: 15‐item Short Inventory of Problems‐Recent (SIP‐2R) |
|
| Notes |
Funding source: NIAAA grant (R01‐AA019664) Declaration of interest: none disclosed |
|
| Risk of bias | ||
| Bias | Authors' judgement | Support for judgement |
| Random sequence generation (selection bias) | Low risk | Participants randomly assigned to receive either the intervention or comparison treatment using a computerized urn randomization procedure. |
| Allocation concealment (selection bias) | Low risk | Researchers enrolling participants could not foresee assignment because participants randomly assigned to receive either the intervention or comparison treatment using a computerized urn randomization procedure. |
| Blinding of participants and personnel (performance bias) All outcomes | Low risk | This is a subjective outcome, likely to be influenced by knowledge of the intervention. However, the report states that the participants in this trial had no knowledge of the different interventions: (quote page 6) "Following randomization, the research coordinator informed each participant of their assignment to either the 'Tuesday group' or 'Wednesday group', but did not refer to the treatment interventions by name." |
| Incomplete outcome data (attrition bias) All outcomes | High risk | Missing outcome data are balanced across intervention and comparison groups (iTSF = 21%; MET/CBT = 30%). |
| Selective reporting (reporting bias) | Low risk | Expected outcomes are reported |
| Comparability of cohorts for baseline characteristics and outcome measures | Low risk | RCT; authors demonstrated balance between groups for the confounders |
| Selection of the non‐exposed cohort | Low risk | Non‐exposed cohort drawn from the same sample origin |
| Protection against contamination | Low risk | Unlikely that the control group received the intervention (groups took place on different days of the week) |
| Blinding of outcome assessment (detection bias) All outcomes | Unclear risk | Insufficient information to make judgment of high or low risk |
Litt 2007.
| Study characteristics | ||
| Methods |
Design: RCT. Participants randomly assigned to one of three outpatient treatment interventions that were conducted over 12 weekly, 60‐minute sessions: NS, NS + CM or CaseM; a control intervention. Data were collected at baseline, post‐treatment (3 months), and at 6 (phone), 9 (in person), 12 (phone), 15 (in person), 18 (phone), 21 (in person), 24 (phone), and 27 (in person) months follow‐up. Recruitment and setting: participants were recruited from October 2002 to March 2005 through newspaper and radio advertisements, as well as the research programs at the site, which is a university medical center. Fidelity assessment of intervention implementation: 2 (report of attempts to ensure adherence/competence with audio or videotape monitoring and rating) |
|
| Participants | 210 men and women with alcohol abuse or dependence (DSM‐IV criteria) Age: the mean sample age was 45 (SD 11.4) years. Gender: the sample was 58% male. Ethnicity: the sample was 86% white, 8% black, 4% Hispanic, and 2% other. |
|
| Interventions |
NS (M) (n = 71): included core topics that were based on the ones used in the Project MATCH TSF, but emphasized and sought to help participants change their social networks from one that reinforces drinking to one that reinforces sobriety. AA attendance was encouraged, and recovery tasks (i.e. homework) were assigned each session and intended to help participants expand their sober social network. NS + CM (M) (n = 70): included the same NS treatment as above, but included reinforcements that were contingent upon participants' completion of tasks (verified by signed slips) between sessions. CaseM (M) (n = 69): with the help of their therapist, participants identified problems in various domains (e.g. interpersonal, psychiatric, medical, financial, etc) that could create barriers to abstinence, selected goals to overcome them, and identified resources for doing so. AA attendance was neither encouraged nor discouraged. CaseM served as an active control intervention and was based on the intervention used in the Marijuana Treatment Project. |
|
| Outcomes |
Abstinence: PDA (measured using Form‐90) and continuous abstinence during the 90‐day period prior to each follow‐up (measured using Form‐90). Self‐reports verified using urine samples (at baseline and post‐treatment to screen for drug use), breathalyzer (at intake, every treatment session in all intervention interventions, and every in‐person follow‐up), and collaterals for one third of participants (randomly selected). Drinking intensity: DDD; measured using Form‐90 Alcohol‐related consequences: DrInC |
|
| Notes |
Included sibling paper(s)
Funding source: NIAAA grant (R01‐AA12827) and in part by NIH General Clinical Research Center Grant M01‐RR06192 Declaration of interest: none disclosed |
|
| Risk of bias | ||
| Bias | Authors' judgement | Support for judgement |
| Random sequence generation (selection bias) | Low risk | Researchers used a computerized urn randomization procedure |
| Allocation concealment (selection bias) | Low risk | Researchers enrolling participants could not foresee assignment. |
| Blinding of participants and personnel (performance bias) All outcomes | High risk | This is a subjective outcome, likely to be influenced by knowledge of the intervention. In the report, sufficient details were provided that participants could be aware of the different interventions: (quote, page 543) "Given the procedures used in each treatment, participants, therapists, and research assistants could not be blinded as to experimental condition." |
| Incomplete outcome data (attrition bias) All outcomes | Unclear risk | Missing outcome data do not appear to be significantly different across intervention and comparison groups (CASE M = 7%; NS = 11%; NS + CM = 16%) but significance test results are not reported. |
| Selective reporting (reporting bias) | Low risk | Expected outcomes are reported |
| Comparability of cohorts for baseline characteristics and outcome measures | Low risk | RCT; authors demonstrated balance between groups for the confounders |
| Selection of the non‐exposed cohort | Low risk | Non‐exposed cohort drawn from the same sample origin |
| Protection against contamination | Low risk | Unlikely that the control group received the intervention (treatments were individually‐delivered) |
| Blinding of outcome assessment (detection bias) All outcomes | Unclear risk | Insufficient information to make judgment of high or low risk |
Litt 2016.
| Study characteristics | ||
| Methods |
Design: RCT. Participants randomly assigned to receive 12 weekly 60‐minute sessions of either an updated NS treatment or PCBT. Recruitment and setting: participants were recruited through newspaper and radio ads from June 2010 through March 2012. Fidelity assessment of intervention implementation: 1 (report of attempts to ensure adherence/competence without audio or videotape) |
|
| Participants | 193 men and women with alcohol dependence (DSM‐IV criteria) Age: the mean sample age was 46.0 (SD 10.5) years. The mean age was 45.1 (SD 9.8) years in the PCBT group and 47.2 (SD 11.2) years in the NS group. Gender: the sample was 65.8% male. The PCBT group was 70.1% male and the NS group was 61.5% male. Ethnicity: the sample was 92.7% white, 2.6% black, 3.1% Hispanic, and 1.6% other. The participants in the PCBT group were 92.8% white, 2.1% black, 3.1% Hispanic, and 2.0% other, and the participants in the NS group were 92.7% white, 3.1% black, 3.1% Hispanic, and 1.0% other. |
|
| Interventions |
NS (M) (n = 96): included core topics that were based on the ones used in the Project MATCH TSF, but emphasized and sought to help participants change their social networks from one that reinforces drinking to one that reinforces sobriety. AA attendance was encouraged, and recovery tasks (i.e. homework) were assigned weekly and intended to help participants expand their sober social network. Importantly, the updated NS program increased the emphasis and amount of time spent on social skills training. PCBT (M) (n = 97): manualized, skill‐based, CBT designed to improve coping skills for interpersonal and intrapersonal problems or experiences that may lead to drinking. AA attendance was neither encouraged nor discouraged, and skills training assignments (i.e. homework) were assigned each week. |
|
| Outcomes |
Follow‐up assessment points: baseline and 3, 9, 15, 21, and 27 months follow‐up (24 months post‐treatment) Abstinence: (PDA; Form‐90) and complete 90‐day abstinent status prior to each follow‐up Drinking intensity: (PDD; Form‐90) and (PDHD; Form‐90) in the 90‐day period prior to each follow‐up Alcohol‐related consequences: DrInC |
|
| Notes |
Funding source: NIAAA grant (R01‐AA12827) and in part by NIH General Clinical Research Center Grant M01‐RR06192 Declaration of interest: none disclosed |
|
| Risk of bias | ||
| Bias | Authors' judgement | Support for judgement |
| Random sequence generation (selection bias) | Low risk | Participants randomly assigned to receive either the intervention or comparison treatment using a computerized urn randomization procedure. |
| Allocation concealment (selection bias) | Low risk | Researchers enrolling participants could not foresee assignment. Participants were randomly assigned to receive either the intervention or comparison treatment using a computerized urn randomization procedure. |
| Blinding of participants and personnel (performance bias) All outcomes | High risk | This is a subjective outcome, likely to be influenced by knowledge of the intervention. In the report, sufficient details were provided that participants could be aware of the different interventions: (quote, page 207) "Given the procedures used in each treatment, neither participants, therapists, nor research assistants could be blinded as to treatment condition." |
| Incomplete outcome data (attrition bias) All outcomes | Unclear risk | Missing outcome data do not appear to be significantly different across intervention and comparison groups (PCBT 15%; NS 17%); but significance test results are not reported. |
| Selective reporting (reporting bias) | Low risk | Expected outcomes are reported. |
| Comparability of cohorts for baseline characteristics and outcome measures | Low risk | RCT; authors demonstrated balance between groups for the confounders |
| Selection of the non‐exposed cohort | Low risk | Non‐exposed cohort drawn from the same sample origin |
| Protection against contamination | Low risk | Unlikely that the control group received the intervention |
| Blinding of outcome assessment (detection bias) All outcomes | Unclear risk | Insufficient information to make judgment of high or low risk |
Lydecker 2010.
| Study characteristics | ||
| Methods |
Design: quasi‐RCT. Participants randomly assigned to receive 24 weeks of either ICBT + P or TSF + P. Recruitment and setting: participants recruited from referrals to the VA SAMI program. SAMI is a dual diagnosis outpatient clinic for veterans with co‐occurring substance use disorder and Axis I disorders. Fidelity assessment of intervention implementation: 0 (no report of attempts to ensure adherence/competence of intervention implementation) |
|
| Participants | 206 veterans with depression and substance use disorder (DSM‐IV criteria) Age: the mean sample age was 48.2 (SD 7.7) years. The mean age was 48.4 (SD 8.1) years in the TSF + P group and 48.0 (SD 7.5) years in the ICBT + P group. Gender: the sample was 92% male, and the TSF + P group and ICBT + P groups were 91% and 93% male, respectively. Ethnicity: the sample was 71% white, and the TSF + P group and ICBT + P groups were 69% and 73% white, respectively. |
|
| Interventions |
TSF + P (M) (n = 99): based on the Project MATCH TSF manual, but adapted to include group sessions (rather than individual). ICBT + P (M) (n = 107): based on CBT for depression and included cognitive behavioral coping skills training for addiction. Treatment consisted of two phases which focused on developing core skills (e.g. managing cognitions, building social network, and increasing healthy activities; phase I), and reviewing and reinforcing the core skills (phase II). |
|
| Outcomes |
Follow‐up assessment points: baseline (intake), mid‐treatment (12 weeks), end of treatment (24 weeks) and 3, 6, 9, and 12 months post‐treatment Abstinence: PDA, measured using TLFB and monthly toxicology screens (required by SAMI) used to help participant recall dates of use |
|
| Notes |
Funding source: VA Medical Research Merit Review Grant awarded to Sandra A Brown and VA Merit Review Entry Program Grant awarded to Susan R Tate Declaration of interest: none disclosed |
|
| Risk of bias | ||
| Bias | Authors' judgement | Support for judgement |
| Random sequence generation (selection bias) | High risk | Researchers use alternation as a non‐random component in the sequence generation process |
| Allocation concealment (selection bias) | High risk | Researchers enrolling participants could possibly foresee assignment (alternation) |
| Blinding of participants and personnel (performance bias) All outcomes | High risk | This is a subjective outcome, likely to be influenced by knowledge of the intervention. In the report, sufficient details were provided that participants could be aware of the different interventions: (quote page 456) "Given the nature of this study in a clinical context, participants, administrators, and interviewers were not blinded to patients' treatment assignment." |
| Incomplete outcome data (attrition bias) All outcomes | Low risk | Missing outcome data is balanced across intervention and comparison groups |
| Selective reporting (reporting bias) | Low risk | Expected outcomes are reported |
| Comparability of cohorts for baseline characteristics and outcome measures | Low risk | RCT; authors demonstrated balance between groups for the confounders |
| Selection of the non‐exposed cohort | Low risk | Non‐exposed cohort drawn from the same sample origin |
| Protection against contamination | Low risk | Unlikely that the control group received the intervention (sequential treatment delivery) |
| Blinding of outcome assessment (detection bias) All outcomes | Unclear risk | Insufficient information to make judgment of high or low risk |
Manning 2012.
| Study characteristics | ||
| Methods |
Design: RCT. Participants randomly assigned to one of three interventions: 12‐Step PI, DI, or NI. Recruitment and setting: participants recruited from a 10‐14 day inpatient alcohol/drug detoxification treatment at the South London and Maudsley NHS Foundation Trust in London. Fidelity assessment of intervention implementation: 0 (no report of attempts to ensure adherence/competence of intervention implementation) |
|
| Participants | 151 participants with alcohol or drug dependence (DSM‐IV criteria) Age: the mean sample age was 39.9 (SD 8.9) years, and 41.0 (SD 9.5) years, 39.8 (SD 8.3) years, and 38.9 (SD 8.9) years in the NI, DI, and PI groups, respectively (P = 0.49). Gender: the sample was 67.2% male (n = 102) , and the NI, DI, and PI groups were 70.8% (n = 34), 67.3% (n = 33), and 64.8% (n = 35) male, respectively (P = 0.81). Ethnicity: the sample was 86.1% white British (n = 130), and the NI, DI, and PI groups were 89.6% (n = 43), 89.9% (n = 44), and 76.9% (n = 43) white British, respectively (P = 0.23). |
|
| Interventions |
PI (M) (n = 54): included a single, one‐on‐one 30‐45 minute session wherein a peer shared their own story about how 12‐step groups had helped them, explained the history of AA/NA/CA and how meetings are structured, discussed stereotypes and barriers to attending AA/NA/CA, and encouraged patients to attend several meetings to find one that fits. This active intervention was based on the manuals and study materials from earlier studies (Blondell 2001; Timko 2006). DI (M) (n = 49): included a single, one‐on‐one 30‐45 minute session wherein a doctor provided encouragement and shared success stories of former patients, explained the history of AA/NA/CA and how meetings are structured, discussed stereotypes and barriers to attending AA/NA/CA, and encouraged patients to attend several meetings to find one that fits. This active intervention was based on the manuals and study materials from earlier studies (Blondell 2001; Timko 2006). NI (NM) (n = 48): patients were provided with a list of meetings on the ward only. |
|
| Outcomes |
Follow‐up assessment points: baseline (second day of detox admission), end of treatment (pre‐discharge), and 2‐3 months post‐treatment (post‐discharge) Abstinence: complete abstinence from the substance for which the participant was receiving treatment |
|
| Notes |
Funding source: Action on Addiction and the Wates Foundation Declaration of interest: none disclosed |
|
| Risk of bias | ||
| Bias | Authors' judgement | Support for judgement |
| Random sequence generation (selection bias) | Low risk | Researchers used random number tables to generate a randomly assigned intervention for each participant. |
| Allocation concealment (selection bias) | Low risk | Researchers enrolling participants could not foresee assignment. Researchers used random number tables to generate a randomly assigned intervention for each participant. |
| Blinding of participants and personnel (performance bias) All outcomes | Unclear risk | This is a subjective outcome, likely to be influenced by knowledge of the intervention. However, we could find no information in the report that the participants in this study had no knowledge of the different interventions. |
| Incomplete outcome data (attrition bias) All outcomes | Low risk | Missing outcome data is balanced across intervention and comparison groups (PI 16.7%; DI 14.3%; NI 18.8%; P > 0.05). |
| Selective reporting (reporting bias) | Low risk | Expected outcomes are reported |
| Comparability of cohorts for baseline characteristics and outcome measures | Low risk | RCT; authors demonstrated balance between groups for the confounders |
| Selection of the non‐exposed cohort | Low risk | Non‐exposed cohort drawn from the same sample origin |
| Protection against contamination | Unclear risk | Unclear if communication between the intervention and comparison groups occurred |
| Blinding of outcome assessment (detection bias) All outcomes | Unclear risk | Insufficient information to make judgment of high or low risk |
MATCH 1997.
| Study characteristics | ||
| Methods |
Design: RCT. Participants randomly assigned to one of three manual‐guided, 12‐week, individually‐delivered treatments: CBT, MET, or TSF. Participants were assigned to groups using an urn randomization procedure that matched participants on several key variables. Recruitment and setting: participants were recruited after completing inpatient or intensive day hospital treatment (aftercare arm) or directly from the community or outpatient treatment centers (outpatient arm). Participants were recruited from five outpatient and five aftercare sites across nine performance sites. 9 performance sites, but one of the sites was both an outpatient and aftercare site, for a total of five outpatient and five aftercare sites Fidelity assessment of intervention implementation: 2 (report of attempts to ensure adherence/competence with audio or videotape monitoring and rating) |
|
| Participants | 1726 participants with alcohol abuse or dependence (DSM‐III‐R) who were receiving aftercare (n = 774) or outpatient (n = 952) therapy at one of nine treatment sites. Age: the mean age was 38.9 (SD= 10.7) years in the outpatient arm, and 41.9 (SD 11.1) in the aftercare arm. Gender: the outpatient arm was 28% female and 72% male, and the aftercare arm was 20% female and 80% male. Ethnicity: participants in the outpatient arm were 80% white, 6% African American, 12% Hispanic, and 2% other, and 80% white, 15% African American, 3% Hispanic, and 1% other in the aftercare arm. |
|
| Interventions |
TSF (M) (n = 582): designed to facilitate AA participation and work on the 12 steps, and encouraged participants to accept alcoholism as a disease, which was viewed as both a spiritual and medical disease. TSF treatment included weekly treatment sessions. CBT (M) (n = 567): designed to help participants develop skills to cope with situations that can lead to relapse, as drinking behavior was viewed as functionally related to problems in participants' lives. Included weekly treatment sessions. MET (M) (n = 577): designed to produce internally‐motivated change that the participant could then mobilize throughout their recovery. MET treatment included four sessions occurring in weeks 1, 2, 6 and 12. |
|
| Outcomes |
Follow‐up assessment points: baseline (across three intake sessions), 3 months (end of treatment), and at 3, 6, 9, and 12 months post‐treatment, as well as 3 and 10 years post‐treatment Abstinence: PDA; complete abstinence Drinking intensity: DDD Alcohol‐related consequences: DrInC Economic savings; healthcare cost offsets: total medical care costs/medical care cost savings |
|
| Notes |
Included sibling paper(s)
Funding source: NIAAA Project MATCH
Declaration of interest: the Project MATCH Research Group is composed of the steering committee members who developed this research protocol and executed all aspects of the trial |
|
| Risk of bias | ||
| Bias | Authors' judgement | Support for judgement |
| Random sequence generation (selection bias) | Low risk | Researchers used a computerized urn randomization procedure |
| Allocation concealment (selection bias) | Low risk | Researchers enrolling participants could not foresee assignment. Researchers used a computerized urn randomization procedure. |
| Blinding of participants and personnel (performance bias) All outcomes | Unclear risk | This is a subjective outcome, likely to be influenced by knowledge of the intervention. However, we could find no information in the report that the participants in this study had no knowledge of the different interventions. |
| Incomplete outcome data (attrition bias) All outcomes | Unclear risk | Overall, a minimum of 90% of all participants completed the follow‐up assessments but it's unclear whether there were attrition differences between treatment interventions as these were not specified. |
| Selective reporting (reporting bias) | Low risk | Expected outcomes are reported |
| Comparability of cohorts for baseline characteristics and outcome measures | Low risk | RCT; authors demonstrated balance between groups for the confounders |
| Selection of the non‐exposed cohort | Low risk | Non‐exposed cohort drawn from the same sample origin |
| Protection against contamination | Low risk | Unlikely that the control group received the intervention (individually‐delivered treatment) |
| Blinding of outcome assessment (detection bias) All outcomes | Unclear risk | Insufficient information to make judgment of high or low risk |
| Blinding of outcome assessment (detection bias) Cost‐effectiveness only | Unclear risk | Insufficient information to make judgment of high or low risk |
McCrady 1996.
| Study characteristics | ||
| Methods |
Design: RCT. Participants randomly assigned to receive 15 weekly, 90‐minute sessions of ABMT, AA + ABMT, or RP + ABMT. Recruitment and setting: participants recruited through an outpatient treatment program, advertisements announcing low‐cost couple's therapy for alcoholism, as well as through community referrals. Fidelity assessment of intervention implementation: 2 (report of attempts to ensure adherence/competence with audio or videotape monitoring and rating) |
|
| Participants | 90 couples (males with alcohol abuse or dependence (DSM‐III‐R criteria) and their female partners) who were seeking joint outpatient behavioral alcoholism treatment Age: the mean age was 39.44 (SD 10.27) years for men and 37.4 (SD 10.3) years for women. Gender: sample was comprised of 90 male participants and their female partners. Ethnicity: participants in the sample were 92.3% Caucasian (understood to be white), 5.7% African American, 1% Hispanic, and 1% Native American. |
|
| Interventions |
AA + ABMT (M) (n = 31): included ABMT and focused on AA. Participants and their partners learned about AA and its philosophy, identified and set attendance goals for meetings, and were encouraged to get a sponsor and work the first steps of AA. RP + ABMT (M) (n = 29): included ABMT plus RP, which included lessons about anticipating high‐risk situations for drinking, identifying relapse warning signs and developing coping skills, as well as four maintenance sessions in the 12 months after treatment (with therapists having the option to schedule two additional sessions each time they met with the couple). ABMT (M) (n = 30): included CBT for both the participant and his partner, behavioral marital therapy, and behavioral self‐recording. |
|
| Outcomes |
Follow‐up assessment points: baseline, throughout treatment using daily self‐recording cards, upon treatment completion (15 weeks), and monthly for 18 months post‐treatment (with in‐person interviews at 6, 12, and 18 months post‐treatment, and the rest over the phone) Abstinence: PDA, measured using TLFB; abstinent/mostly abstinent across follow‐up period Drinking intensity: time to first heavy drinking day (at follow‐up); DDD, during treatment. During treatment, participants reported the number of drinks per day on daily self‐recording cards and their partners also used daily self‐recording cards to report subjective estimates of the participant's drinking (i.e. abstinent, light, moderate, or heavy). |
|
| Notes |
Included sibling paper(s)
Additional notes
Funding source: NIAAA grant AA07070 Declaration of interest: none disclosed |
|
| Risk of bias | ||
| Bias | Authors' judgement | Support for judgement |
| Random sequence generation (selection bias) | Low risk | Following an inquiry and direct correspondence to clarify the nature of the randomization from the first author (Barbara McCrady) on 21 Jan 2018, the researchers used sealed, opaque, envelopes which were prepared with an index card inside each one with the treatment intervention on it (with an equal number of cards for each intervention). The Research Assistant pulled out an envelope at the end of the baseline assessment and opened it to find out which treatment intervention the patient was assigned to. |
| Allocation concealment (selection bias) | Low risk | Researchers prepared opaque envelopes (9‐12 per batch) with an index card inside each one with the treatment intervention on it (with an equal number of cards for each intervention). The Research Assistant would then pull out an envelope at random at the end of the baseline assessment and open it with the participant to find out the intervention to which they had been assigned. |
| Blinding of participants and personnel (performance bias) All outcomes | Unclear risk | This is a subjective outcome, likely to be influenced by knowledge of the intervention. However, we could find no information in the report that the participants in this study had no knowledge of the different interventions. |
| Incomplete outcome data (attrition bias) All outcomes | Unclear risk | Not mentioned |
| Selective reporting (reporting bias) | Low risk | Expected outcomes are reported |
| Comparability of cohorts for baseline characteristics and outcome measures | Low risk | RCT; authors demonstrated balance between groups for the confounders |
| Selection of the non‐exposed cohort | Low risk | Non‐exposed cohort drawn from the same sample origin |
| Protection against contamination | Low risk | Unlikely that the control group received the intervention (individually‐delivered as outpatient) |
| Blinding of outcome assessment (detection bias) All outcomes | Unclear risk | Insufficient information to make judgment of high or low risk |
Mundt 2012.
| Study characteristics | ||
| Methods |
Design: cost‐benefit study. Compared healthcare use and costs among individuals who reported any 12‐step participation after alcohol and other drug treatment (i.e. during follow‐up) to those who did not. Recruitment and setting: participants were recruited between March 2000 and May 2002 from four Chemical Dependency Recovery Programs of Kaiser Permanente Northern California, which are abstinence‐based and last approximately 1 year (including treatment and aftercare). Fidelity assessment of intervention implementation: 0 (not applicable) |
|
| Participants | 419 participants enrolled in the study. 403 adolescents completed at least one follow‐up interview and were included in the analyses. Age: participants ranged from 13‐18 years old at baseline (i.e. ranged in age from 18‐25 at 7‐year follow‐up) and the mean age at baseline was 16.14 (SD 1.26) years. Gender: the sample was 66% male. Ethnicity: the sample was 49% white, 20% Hispanic, 16% African‐American, 9% Native American, and 6% Asian. |
|
| Interventions |
12‐step participants (n = 201): participants reported attending 10 or more 12‐step meetings at 6 months, or 1‐, 3‐ or 5‐year follow‐up. No 12‐step (n = 202): did not participate in 12‐step at 6 months, or 1‐, 3‐ or 5‐year follow‐up. |
|
| Outcomes |
Follow‐up assessment points: baseline, 6 months post‐intake, and 1, 3, 5, and 7 years post‐intake. Medical care use data examined for three time periods: 1 to 3, 3 to 5, and 5 to 7 years post‐intake. Economic savings; healthcare cost offsets: number of hospital inpatient days, emergency room (ER) visits, primary care visits, and psychiatric visits; alcohol and other drug treatment costs; and total medical care costs. |
|
| Notes |
Funding source: Robert Wood Johnson Foundation (Grant #037863), the Center for Substance Abuse Treatment (Grant #00M007436), NIDA (R01‐DA15803), and NIAAA (K01‐AA018410‐01 and R01‐AA018142‐01A1) Declaration of interest: none disclosed |
|
| Risk of bias | ||
| Bias | Authors' judgement | Support for judgement |
| Random sequence generation (selection bias) | High risk | Non‐random assignment of participants (observational cohort design) |
| Allocation concealment (selection bias) | High risk | Non‐random assignment of participants (observational cohort design) |
| Blinding of participants and personnel (performance bias) All outcomes | Low risk | This is not a subjective outcome (i.e. economic) and therefore unlikely to be influenced by knowledge of the intervention. |
| Incomplete outcome data (attrition bias) All outcomes | Unclear risk | Although general follow‐up rates across the seven‐year follow‐up were all above 84%, there was no mention of follow‐up rates between 12‐step attendees versus non‐attendees. |
| Selective reporting (reporting bias) | Low risk | Expected outcomes are reported. |
| Comparability of cohorts for baseline characteristics and outcome measures | Low risk | Adjusted analyses for most important confounding factors and imbalance |
| Selection of the non‐exposed cohort | Low risk | Non‐exposed cohort drawn from the same sample origin. |
| Protection against contamination | Low risk | Unlikely that the control group received the intervention (community AA open to everyone, but the group definition (i.e. "No 12‐Step") prevents overlap) |
| Blinding of outcome assessment (detection bias) Cost‐effectiveness only | Unclear risk | Insufficient information to make judgment of high or low risk |
Ouimette 1997.
| Study characteristics | ||
| Methods |
Design: non‐randomized. A naturalistic, multiple‐site evaluation of 15 Department of VA substance abuse treatment programs that were either 12‐step, CBT, or eclectically (12‐step/CBT) oriented. Recruitment and setting: participants recruited from 15 VA Medical Center inpatient substance use disorder treatment programs that had either a CBT (5 programs), 12‐step (5 programs), or eclectic (combined 12‐step/CBT; 5 programs) treatment orientation. Fidelity assessment of intervention implementation: 0 (non‐manualized) |
|
| Participants | 3018 substance‐dependent (DSM‐III‐R, ICD‐9) male participants who completed medical detoxification and were admitted to the inpatient treatment program Age: mean sample age was 43 (SD 9.63) years. Gender: sample participants were male only (women were excluded due to their small numbers). Ethnicity: 49% of sample participants were African American, 46% were Caucasian (understood to be white), 3% were Hispanic/Latino, and 2% were Native American, Asian, or of another racial/ethnic background. |
|
| Interventions |
12‐step (NM) (n = 897): treatment programs emphasized 12‐step meeting attendance (in the hospital and in the community), therapy groups that covered related topics such as working the steps and the Big Book, accepting an alcoholic identity, acknowledging powerlessness over the problem substance, and abstinence. Eclectic (combined 12‐step/CBT; NM) (n = 973): treatment programs used a combination of CBT and 12‐step treatment approaches. CB (NM) (n = 1148): treatment programs emphasized cognitive and behavioral skills training, abstinence skills training, and RP with the goal of enabling participants to learn ways to cope with and manage high‐risk situations, and to better understand and acknowledge the effects of using their problem substance. |
|
| Outcomes |
Follow‐up assessment points: data collected at baseline (Intake Information Form; IIF), discharge (Discharge Information Form; DIF), 1‐year follow‐up (Follow‐up Information Form; FIF; Ouimette 1997, Humphreys 2001), and 2‐year follow‐up (Humphreys 2007). Abstinence: proportion completely abstinent/abstinence from alcohol and drugs (verified using biological tests when possible) Economic savings; healthcare cost offsets: compared healthcare utilization and costs in the year before and the year after inpatient treatment |
|
| Notes |
Included sibling paper(s):
Funding source: Department of Veterans Affairs Mental Health Strategic Health Group at the Veterans Affairs National Headquarters, Washington, DC
Declaration of interest: none disclosed |
|
| Risk of bias | ||
| Bias | Authors' judgement | Support for judgement |
| Random sequence generation (selection bias) | High risk | Non‐randomized study. Participants were compared who were being treated naturalistically in one of three different types of VA residential treatment programs (TSF, CBT, or eclectic). |
| Allocation concealment (selection bias) | High risk | Risk is high due to the study being non‐randomized. |
| Blinding of participants and personnel (performance bias) All outcomes | Low risk | This is a subjective outcome, likely to be influenced by knowledge of the intervention. However, because the interventions were delivered in discreet hospitals in different regions of the country, participants had no knowledge of the different types of interventions being delivered other than their own. |
| Incomplete outcome data (attrition bias) All outcomes | High risk | CBT treatment follow‐up rate 85%; TSF 78%; TSF/CB (eclectic) 81%; P < 0.001) |
| Selective reporting (reporting bias) | Low risk | Expected outcomes are reported. |
| Comparability of cohorts for baseline characteristics and outcome measures | Low risk | Adjusted analyses for most important confounding factors and imbalance |
| Selection of the non‐exposed cohort | Low risk | Non‐exposed cohort drawn from the same sample origin. |
| Protection against contamination | Low risk | Unlikely that the control group received the intervention (no chance of contamination because study sites were very far apart) |
| Blinding of outcome assessment (detection bias) All outcomes | Unclear risk | Insufficient information to make judgment of high or low risk |
| Blinding of outcome assessment (detection bias) Cost‐effectiveness only | Low risk | Researchers enrolling participants could not foresee assignment (healthcare data were coded automatically with no knowledge of intervention) |
Timko 2006.
| Study characteristics | ||
| Methods |
Design: RCT. Participants randomly assigned to receive either a standard referral to self‐help or an intensive referral to self‐help. Recruitment and setting: participants were recruited upon entry to a VA outpatient substance use disorder treatment program that had a combined CB/TSF orientation and was abstinence‐based. Fidelity assessment of intervention implementation: 2 (report of attempts to ensure adherence/competence with audio or videotape monitoring and rating) |
|
| Participants | 345 individuals with substance use disorder who were entering a new treatment episode. 281 at 6‐month follow‐up. Age: the mean sample age was 50 years. The mean age in the standard referral group was 50.7 years and 50.2 years in the intensive referral group (P = 0.49). Gender: the sample was 98% male. The standard referral group was 97.6% male and the intensive referral group was 97.8% male (P = 1.00). Ethnicity: the sample was 43% white. 39% of participants in the standard referral group and 47.0% of participants in the intensive referral group were white (P = 0.17). |
|
| Interventions |
Intensive referral (M) (n = 181): involved giving participants an AA/NA schedule and encouraging them to attend. Standard referral (M) (n = 164): involved counselors giving participants an AA/NA schedule and materials about the 12‐step philosophy, arranging a meeting between the participant and an existing AA/NA member, agreeing on a meeting for the participant to attend, providing participants with sponsor information, and following up with patients in future sessions. |
|
| Outcomes |
Follow‐up assessment points: baseline, 6‐ (Timko 2006) and 12‐month (Timko 2007) follow‐ups. Abstinence: complete abstinence from alcohol and from drugs (measured using the ASI) Alcohol addiction severity: ASI alcohol and drug composites score to measure the number, extent and duration of symptoms in participants' lifetimes and in the past 30 days |
|
| Notes |
Included sibling paper(s)
Funding source: Department of Veterans Affairs Office of Research and Development (Health Services Research and Development Service, IIR 20‐067 and RCS 00‐001) Declaration of interest: none disclosed |
|
| Risk of bias | ||
| Bias | Authors' judgement | Support for judgement |
| Random sequence generation (selection bias) | Low risk | Participants randomly assigned to receive either the intervention or comparison treatment using a randomized procedure wherein ID numbers, to be given sequentially to participants, were randomly preselected within different sized blocks to be assigned to each intervention. |
| Allocation concealment (selection bias) | Low risk | Researchers enrolling participants could not foresee assignment. Participants randomly assigned to receive either the intervention or comparison treatment using a randomized procedure wherein ID numbers, to be given sequentially to participants, were randomly preselected within different sized blocks to be assigned to each intervention. |
| Blinding of participants and personnel (performance bias) All outcomes | Unclear risk | This is a subjective outcome, likely to be influenced by knowledge of the intervention. However, we could find no information in the report that the participants in this study had no knowledge of the different interventions. |
| Incomplete outcome data (attrition bias) All outcomes | Unclear risk | Data not provided |
| Selective reporting (reporting bias) | Low risk | Expected outcomes are reported |
| Comparability of cohorts for baseline characteristics and outcome measures | Low risk | RCT; authors demonstrated balance between groups for the confounders |
| Selection of the non‐exposed cohort | Low risk | Non‐exposed cohort drawn from the same sample origin |
| Protection against contamination | Low risk | Unlikely that the control group received the intervention (treatments were individually‐delivered) |
| Blinding of outcome assessment (detection bias) All outcomes | Unclear risk | Insufficient information to make judgment of high or low risk |
Timko 2011.
| Study characteristics | ||
| Methods |
Design: quasi‐RCT study using an 'ON/OFF' design wherein standard or intensive referral interventions were delivered through group counseling in alternate 3‐month periods over 12 months. Participants received either standard or intensive referral to DFGs. Recruitment and setting: participants were recruited from a VA outpatient mental health treatment program in Northern California. Fidelity assessment of intervention implementation: 2 (report of attempts to ensure adherence/competence with audio or videotape monitoring and rating) |
|
| Participants | 287 individuals with a dual diagnosis of a substance use disorder and a psychiatric disorder who were beginning a new treatment episode. Age: the mean sample age was 51.0 (SD 8.9) years. The mean age in the standard referral group was 51.2 (SD 8.8) years and 50.9 (SD 9.0) years in the intensive referral group (P = 0.78). Gender: the sample was 90.9% male. The standard referral group was 89.7% male and the intensive referral group was 92.3% male (P = 0.44). Ethnicity: the sample was 48.8% white. 51.7% of participants in the standard referral group and 45.8% of participants in the intensive referral group were white (P = 0.31). |
|
| Interventions |
Intensive referral (M) (n = 142): participants were required to attend four additional outpatient sessions within one month. The group counselor gave participants the DFG schedule, specific directions to meetings and reviewed a DFG handout (session 1); further discussed the DFG handout and facilitated a practice meeting (session 2); arranged to have a DFG member go to the group to give a personal history and meet participants (session 3); and followed‐up with participants to see if they had attended a meeting (session 4). Standard referral (M) (n = 145): counselor gave participants the DFG schedule and using a standardized script, encouraged them to attend. |
|
| Outcomes |
Follow‐up assessment points: baseline and 6‐month follow‐up Abstinence: number of days in the past 30 days that the participant used alcohol and used drugs (measured using ASI), from which PDA was derived; complete abstinence from alcohol, from other drugs, from alcohol and other drugs Alcohol addiction severity: ASI composite scores (alcohol, drug, psychiatric) to measure number and duration of symptoms in the participant's life and in the past 30 days |
|
| Notes |
Funding source: Department of Veterans Affairs (VA) Office of Research and Development (Health Services Research & Development Service, IIR 05‐014, RCS 00‐001, and RCS 90‐001), and the VA Office of Academic Affiliations (TPP 65‐500) Declaration of interest: none disclosed |
|
| Risk of bias | ||
| Bias | Authors' judgement | Support for judgement |
| Random sequence generation (selection bias) | High risk | Researchers use alternation as a non‐random component in the sequence generation process |
| Allocation concealment (selection bias) | High risk | Researchers enrolling participants could possibly foresee assignment (alternation) |
| Blinding of participants and personnel (performance bias) All outcomes | Low risk | This is a subjective outcome, likely to be influenced by knowledge of the intervention. However, we believe it is unlikely that participants in this study had knowledge of the two different interventions because a sequential ON/OFF design was used to expressly avoid this. |
| Incomplete outcome data (attrition bias) All outcomes | Unclear risk | No details provided |
| Selective reporting (reporting bias) | Low risk | Expected outcomes are reported |
| Comparability of cohorts for baseline characteristics and outcome measures | Low risk | Authors demonstrated balance between groups for the confounders |
| Selection of the non‐exposed cohort | Low risk | Non‐exposed cohort drawn from the same sample origin |
| Protection against contamination | Low risk | Unlikely that the control group received the intervention (alternating groups were used to reduce contamination risk) |
| Blinding of outcome assessment (detection bias) All outcomes | Low risk | Blinding of outcome assessment (trained research interviewers blind to intervention), and unlikely that blinding could have been broken |
Vederhus 2014.
| Study characteristics | ||
| Methods |
Design: quasi‐RCT. Participants were randomly assigned to receive either a MI or BA to attend 12‐step groups. Recruitment and setting: participants were recruited between September 2008 and August 2010 from an in‐patient detox in Norway Fidelity assessment of intervention implementation: 0 (no report of attempts to ensure adherence/competence of intervention implementation) |
|
| Participants | 140 participants with substance use disorder (confirmed at baseline using the Mini International Neuropsychiatric Interview) who were being discharged back to their home and thus able to attend 12‐step groups. Age: the mean sample age was 41 (SD 14) years. The mean age was 43 (SD 13) years in the MI group and 40 (SD 14) years in the BA group. Gender: the sample was 33% female and 67% male. The MI group was 72% male (n = 49) and the BA group was 63% (n = 45) male. Ethnicity: 96% of the sample were native Norwegians or European‐born. The MI group and BA group were 96% (n = 65) and 96% (n = 69) native Norwegians or European‐born, respectively. |
|
| Interventions |
MI (M) (n = 68): participants received standard detox and two weekly 30‐minute sessions wherein participants were educated about addiction as a chronic disease, discussed personal experiences with and misconceptions about AA, and 12‐step volunteers were invited to the unit to meet with participants. BA (M) (n = 72): participants received standard detox and were given a list of local 12‐step groups and briefly advised to attend. |
|
| Outcomes |
Follow‐up assessment points: baseline (in hospital) and 6‐month post‐treatment follow‐up Abstinence: number of days of alcohol use and drug use in the past 30 days, from which PDA was derived; no alcohol or drug use in the past 30 days (i.e. complete abstinence) Alcohol addiction severity: Alcohol use and drug use severity measured using the ASI, European Version (EuropASI) |
|
| Notes |
Funding source: The Norweigan Research Council; United States: Christine Timko was supported by VA HSR&D (RCS 00‐001) Declaration of interest: none disclosed |
|
| Risk of bias | ||
| Bias | Authors' judgement | Support for judgement |
| Random sequence generation (selection bias) | High risk | Researchers used alternation as a non‐random component in the sequence generation process |
| Allocation concealment (selection bias) | High risk | Researchers enrolling participants could possibly foresee assignment (alternation) |
| Blinding of participants and personnel (performance bias) All outcomes | Unclear risk | This is a subjective outcome, likely to be influenced by knowledge of the intervention. However, we could find no information in the report that the participants in this study had no knowledge of the different interventions. |
| Incomplete outcome data (attrition bias) All outcomes | High risk | Missing outcome data were generally moderate and did not appear to differ significantly across interventions (MI 18%; BA 21%), but no statistical test for this difference was reported. |
| Selective reporting (reporting bias) | Low risk | Expected outcomes are reported |
| Comparability of cohorts for baseline characteristics and outcome measures | Low risk | RCT; authors demonstrated balance between groups for the confounders |
| Selection of the non‐exposed cohort | Low risk | Non‐exposed cohort drawn from the same sample origin |
| Protection against contamination | Low risk | Unlikely that the control group received the intervention (alternating groups were used to reduce contamination risk) |
| Blinding of outcome assessment (detection bias) All outcomes | Low risk | Blinding of outcome assessment (trained research interviewers blind to intervention), and unlikely that blinding could have been broken |
Walitzer 2009.
| Study characteristics | ||
| Methods |
Design: RCT. Participants randomly assigned to 1 of 3 interventions, each consisting of a 12‐session manualized skills‐based treatment package but differing in the discussion of AA and extent to which AA materials were covered: MOT, DIR, or TAU (no specific emphasis on AA). Data collected at baseline, end of treatment, and 3 (phone), 6 (in person), 9 (phone), and 12 (in person) months post‐treatment. Recruitment and setting: participants were recruited from the outpatient Clinical Research Center at the Research Institute on Addictions in Buffalo, NY Fidelity assessment of intervention implementation: 2 (report of attempts to ensure adherence/competence with audio or videotape monitoring and rating) |
|
| Participants | 169 alcoholic participants recruited from the Clinical Research Center Age: the mean age of the sample was 43.8 (SD 11.0) years. The mean age was 45.2 (SD 11.8) years in the TAU group, 40.8 (SD 10.9) years in the DIR group, and 45.3 (SD 9.9) in the MOT group. Gender: the sample was 66.3% male and 33.7% female. The TAU group was 65.5% male and 34.5% female, the DIR group 62.3% male and 37.7% female, and the MOT group 70.7% male and 29.3% female. Ethnicity: the sample was 88.2% white, 9.5% black, and 2.4% other. The TAU group was 86.2% white, 12.1% black, and 1.7% other; the DIR group 88.7% white, 9.4% black, and 1.9% other; and the MOT group 89.7% white, 6.9% black, and 3.4% other. |
|
| Interventions |
DIR (M) (n = 53): therapists used a therapist‐directed AA facilitation consistent with the Project MATCH TSF MOT (M) (n = 58): therapists used a motivational enhancement approach to encouraging AA attendance TAU (M) (n = 58): therapists provided CBT and the standard instruction to "attend at least a couple of AA meetings each week" (p. 5) |
|
| Outcomes |
Follow‐up assessment points: baseline, end of treatment, and 3 (phone), 6 (in person), 9 (phone), and 12 months (in person) post‐treatment Abstinence: PDA; measured using TLFB interview, reported by the participant and participant's collateral Drinking intensity: PDHD; using TLFB interview, reported by the participant and participant's collateral Alcohol‐related consequences: DrInC to assess a range of negative effects of alcohol use |
|
| Notes |
Funding source: NIH grant AA11529 Declaration of interest: none disclosed |
|
| Risk of bias | ||
| Bias | Authors' judgement | Support for judgement |
| Random sequence generation (selection bias) | Low risk | Researchers used a computerized urn randomization procedure. |
| Allocation concealment (selection bias) | Low risk | Researchers enrolling participants could not foresee assignment because a computerized urn randomization procedure was conducted. |
| Blinding of participants and personnel (performance bias) All outcomes | Unclear risk | This is a subjective outcome, likely to be influenced by knowledge of the intervention. However, we could find no information in the report that the participants in this study had no knowledge of the different interventions. |
| Incomplete outcome data (attrition bias) All outcomes | Low risk | Missing outcome data overall were low and moderately low also across treatment interventions (TAU 24%; DIR 11%; MOT 17%) but no significance test was reported. |
| Selective reporting (reporting bias) | Low risk | Expected outcomes are reported |
| Comparability of cohorts for baseline characteristics and outcome measures | Low risk | RCT; authors demonstrated balance between groups for the confounders |
| Selection of the non‐exposed cohort | Low risk | Non‐exposed cohort drawn from the same sample origin |
| Protection against contamination | Low risk | Unlikely that the control group received the intervention (treatments were individually‐delivered) |
| Blinding of outcome assessment (detection bias) All outcomes | Unclear risk | Insufficient information to make judgment of high or low risk |
Walitzer 2015.
| Study characteristics | ||
| Methods |
Design: RCT. Participants randomly assigned to receive 12, 60‐minute sessions of either an AM treatment or AAF treatment. Researchers used an urn randomization procedure that balanced groups by gender and pre‐treatment Brief Symptom Inventory‐hostility scores. Recruitment and setting: participants recruited through newspaper ads over a 17‐month period that began in March, 2011. Data collected at the University at Buffalo Research Institute on Addictions' Clinical Research Center. Fidelity assessment of intervention implementation: 1 (report of attempts to ensure adherence/competence without audio or videotape) |
|
| Participants | 76 alcohol dependent (DSM‐IV) men and women who scored moderate or above on anger measure Age: the mean age of the sample was 46.3 (SD 8.8) years. The mean age was 46.7 (SD 8.6) years in the AAF group and 45.9 (SD 9.0) in the AM group. Gender: the sample was 55.3% male and 44.7% female. The AAF group was 57.5% male and 42.5% female and the AM group was 52.8% male and 47.2% female. Ethnicity: the sample was 77.3% white, 12.0% black, and 10.7% other. The AAF group was 74.4% white, 15.4% black, and 10.3% other, and the AM group 80.6% white, 8.3% black, and 11.1% other. |
|
| Interventions |
AAF (M) (n = 40): treatment focused primarily on facilitating mutual‐help groups (e.g. AA), monitoring client progress, and structured problem solving of alcohol‐related problems. The treatment content was derived from Project MATCH TSF and another AAF treatment. AM (M) (n = 36): treatment focused on developing relaxation and cognitive coping skills for anger, as well as applying these skills to cope with anger situations identified as high risk for alcohol use/relapse |
|
| Outcomes |
Follow‐up assessment points: baseline (pre‐treatment), end of treatment, and 3‐ and 6‐month post‐treatment follow‐ups. Abstinence: PDA; TLFB interview Drinking intensity: DDD; TLFB interview Alcohol‐related consequences: short inventory of problems |
|
| Notes |
Funding source: NIAAA grant (R01‐AA17603) Declaration of interest: none disclosed |
|
| Risk of bias | ||
| Bias | Authors' judgement | Support for judgement |
| Random sequence generation (selection bias) | Low risk | Researchers used a computerized urn randomization procedure |
| Allocation concealment (selection bias) | Low risk | Researchers enrolling participants could not foresee assignment, because researchers used a computerized urn randomization procedure. |
| Blinding of participants and personnel (performance bias) All outcomes | Unclear risk | This is a subjective outcome, likely to be influenced by knowledge of the intervention. However, we could find no information in the report that the participants in this study had no knowledge of the different interventions. |
| Incomplete outcome data (attrition bias) All outcomes | High risk | Missing outcome data were moderately high in one intervention (AM 30%) but low in the other (AAF 12.5%), but no significance test was provided. |
| Selective reporting (reporting bias) | Low risk | Expected outcomes are reported |
| Comparability of cohorts for baseline characteristics and outcome measures | Low risk | RCT; authors demonstrated balance between groups for the confounders |
| Selection of the non‐exposed cohort | Low risk | Non‐exposed cohort drawn from the same sample origin |
| Protection against contamination | Low risk | Unlikely that the control group received the intervention (manualized treatments and supervision for fidelity to treatment) |
| Blinding of outcome assessment (detection bias) All outcomes | Low risk | Blinding of outcome assessment (research assessment separate from clinical care), and unlikely that blinding could have been broken: (quote, page 84) "Interviewers were blind to intervention condition." |
Zemore 2018.
| Study characteristics | ||
| Methods |
Design: non‐randomized study. Mutual‐help organization (12‐step and non‐12‐step) members completed a baseline assessment, and followed up 6 and 12 months later. All assessments were completed online. Recruitment and setting: non‐12‐step participants recruited with the help of WFS, LifeRing, SMART Recovery leaders (i.e. Executive Directors, Board Chair, and/or President) who sent email advertisements to group leaders and individual members. 12‐step participants recruited using advertisements on InTheRooms, a social network for the recovery community. Fidelity assessment of intervention implementation: 0 (non‐manualized) |
|
| Participants | 647 men and women with a lifetime alcohol use disorder (DSM‐5) who had attended at least one in‐person 12‐step, SMART Recovery, LifeRing, or WFS meeting in the past 30 days. Age: the age breakdown of the sample is as follows: in the 12‐step group, 5.3% of participants were 20‐29, 12.0% were 30‐39, 27.4% were 40‐49, 34.1% were 50‐50, 16.8% were 60‐69, and 4.3% were ≥ 70 years old; in the WFS group, 1.7% of participants were 20‐29, 20.9% were 30‐39, 15.3% were 40‐49, 35.0% were 50‐50, 21.5% were 60‐69, and 5.6% were ≥ 70 years old; in the LifeRing group, 4.0% of participants were 20‐29, 13.1% were 30‐39, 12.1% were 40‐49, 30.3% were 50‐50, 28.3% were 60‐69, and 12.1% were ≥ 70 years old; in the SMART group, 6.0% of participants were 20‐29, 18.0% were 30‐39, 26.3% were 40‐49, 25.1% were 50‐50, 21.6% were 60‐69, and 3.0% were ≥ 70 years old. Gender: the 12‐step group was 68.3% female and 31.7% male, the WFS group 100% female, the LifeRing group 38.4% female and 61.6% male, and the SMART group 39.5% female and 60.5% male. Ethnicity: the 12‐step group was 94.2% white, 3.4% black/African American, 1.4% Latino/Hispanic, and 1.0% other; the WFS group 91.4% white, 1.7% black/African American, 4.6% Latino/Hispanic, and 2.3% other; the LifeRing group 85.9% white, 0% black/African American, 10.1% Latino/Hispanic, and 4.0% other; and the SMART group 94.0% white, 1.2% black/African American, 3.0% Latino/Hispanic, and 1.8% other. |
|
| Interventions |
Twelve‐step (NM) (n = 208): participants who attend 12‐step groups only, or those who attend 12‐step and non‐12 step groups, but who identify a 12‐step group as their primary group. The proportion of participants in the 12‐step group who attended AA (e.g. as opposed to NA) could not be determined from the report, though all participants met criteria for a lifetime alcohol use disorder. WFS (NM) (n = 175): participants who attend WFS only, or those who attend multiple mutual‐help organizations but who identify WFS as their primary group LifeRing(NM) (n = 98): participants who attend LifeRing only, or those who attend multiple mutual‐help organizations but who identify LifeRing as their primary group SMART Recovery (NM) (n = 166): participants who attend SMART Recovery only, or those who attend multiple mutual‐help organizations but who identify SMART Recovery as their primary group |
|
| Outcomes |
Follow‐up assessment points: baseline, 6‐ and 12‐month follow‐ups Abstinence: alcohol abstinence, complete abstinence from alcohol and drugs (Composite International Diagnostic Interview alcohol section) Alcohol‐related consequences: short inventory of problems |
|
| Notes | Participant demographic information reported in Zemore 2017 Funding source: NIAAA grant (R21‐AA022747) Declaration of interest: none disclosed |
|
| Risk of bias | ||
| Bias | Authors' judgement | Support for judgement |
| Random sequence generation (selection bias) | High risk | Non‐randomized |
| Allocation concealment (selection bias) | High risk | Risk is high due the study being non‐randomized |
| Blinding of participants and personnel (performance bias) All outcomes | High risk | This is a subjective outcome, likely to be influenced by knowledge of the intervention. In the report, sufficient details were provided that participants were definitely aware of the interventions as patients themselves self‐selected into the various mutual‐help group interventions and this was not under researcher control. |
| Incomplete outcome data (attrition bias) All outcomes | Unclear risk | Overall there was an attrition rate of 17% at 12 months; there was no statistical difference in attrition by mutual‐help organization participation. |
| Selective reporting (reporting bias) | Low risk | Expected outcomes are reported |
| Comparability of cohorts for baseline characteristics and outcome measures | Low risk | Recruited cohorts appear reasonably similar. |
| Selection of the non‐exposed cohort | Low risk | Non‐exposed cohort drawn from the same sample origin |
| Protection against contamination | Unclear risk | This was a naturalistic, observational cohort design and some mutual help‐organization members attending one organization (e.g. SMART Recovery) also could attend another (e.g. 12‐step). |
| Blinding of outcome assessment (detection bias) All outcomes | Low risk | Lack of specific details provided but outcomes are unlikely to be influenced by lack of blinding. |
AA: Alcoholics Anonymous AAF: Alcoholics Anonymous facilitation AA‐NA: Alcoholics Anonymous‐Narcotics Anonymous ABMT: alcohol‐focused behavioral marital therapy AM: alcohol‐adapted anger management ASI: Addiction Severity Index ASI‐Lite: Addiction Severity Index‐Lite BA: brief advice CA: Cocaine Anonymous CaseM: case management CBT: cognitive behavioral therapy CM: contingency management DDD: drinks per drinking day DFG: dual‐focused mutual‐help group DI: doctor intervention DIR: directive approach to facilitating AA DrInC: Drinker Inventory of Consequences DSM III‐R: Diagnostic and Statistical Manual of Mental Disorders ‐ 3rd Edition revised DSM‐IV: Diagnostic and Statistical Manual of Mental Disorders ‐ 4th Edition ICBT + P: integrated cognitive behavioral therapy plus standard pharmacotherapy i‐TSF: integrated 12‐Step Facilitation MAAEZ: Making AA Easier ME‐12: extended motivational enhancement MET: motivational enhancement therapy MBRP: mindfulness‐based relapse prevention MHCD: Mental Health Chemical Dependence MHG: mutual‐help group MI: motivational intervention MOT: motivational enhancement approach to facilitating AA MT: minimal treatment NA: Narcotics Anonymous NI: no intervention NM: non‐manualized NS: network support PCBT: packaged CBT PDA: percentage days abstinent PDHD: percentage days heavy drinking PI: peer intervention P‐TSF: peer‐delivered Twelve‐Step Facilitation RAIR: rural‐adapted intensive referral RCT: randomized controlled trial RP: relapse prevention SAMI: Substance Abuse Mental Illness SD: standard deviation SMART: Self‐Management and Recovery Training SR: standard referral ST: standard outpatient treatment SWT: standard short‐term treatment ward TAU: treatment as usual; TLFB: Timeline Followback TSF: Twelve‐Step Facilitation TSF + P: Twelve‐Step Facilitation plus standard pharmacotherapy UC: usual care VA: Veterans Affairs WFS: Women for Sobriety
Characteristics of excluded studies [ordered by study ID]
| Study | Reason for exclusion |
|---|---|
| Banerjee 2007 | The participants did not meet inclusion criteria because the majority of the sample had a primary substance other than alcohol (methamphetamine). |
| Hailemariam 2018 | The study design did not meet inclusion criteria because it was a cross‐sectional study. |
| Lash 2011 | The study design did not meet inclusion criteria because it was a literature review. |
| Lash 2013 | The study participants did not meet inclusion criteria because only a subset of participants (33%) had an alcohol use disorder only, and the remaining participants were drug dependent with or without alcohol dependence. The proportion of drug dependent participants who were also alcohol dependent was unclear. |
| Laudet 2007 | The study participants did not meet inclusion criteria, as they were described as all polysubstance dependent and only a small proportion (< 20%) reported alcohol as a 'problem substance'. |
| Moos 1999 | The study participants did not meet inclusion criteria as it was unclear which proportion of the sample had an alcohol use disorder or had alcohol as a primary substance. |
| Morgan‐Lopez 2013 | The study intervention did not meet inclusion criteria, as the treatment interventions did not include AA/TSF. |
| Mueller 2007 | The study design and intervention did not meet inclusion criteria, as it was a correlational study and neither intervention included AA/TSF. |
| Schilling 2002 | The study intervention did not meet inclusion criteria, as neither the standard care intervention nor the comparison intervention (motivational interviewing) included AA/TSF. |
| Ståhlbrandt 2007 | This study participants did not meet inclusion criteria because it was not a study of people with alcohol use disorder (i.e. was a non‐clinical sample, which included non‐drinkers) |
| Tonigan 2010 | The study intervention did not meet inclusion criteria, as it was a moderator study examining social phobia as a moderator of the effect of gender on 12‐step participation and substance use outcomes. |
| Villanueva 2007 | The study design did not meet inclusion criteria, as it was a secondary analysis of only a subset of Project MATCH participants (i.e. was an investigation of racial‐ethnic moderators and not main effects). |
| Walsh 1991 | The study participants did not meet inclusion criteria, because some participants were coerced to participate. |
TSF: Twelve‐Step Facilitation VA: Veteran Affairs
Differences between protocol and review
Added fourth primary outcome: alcohol addiction severity (e.g. Addiction Severity Index (ASI)), as a post hoc decision was made that this is an important outcome for decision makers and therefore should be included in this review.
Changed coercion wording (eligible participants) as we had omitted to mention coercion beyond the criminal justice system (e.g. employer, family).
Changed 'Risk of bias' ratings (added three other types of bias risks and removed one other) to help enhance and make the ratings for risk of bias comprehensive.
Contributions of authors
JK: conceived the review together with KH and MF. Wrote the first draft of the protocol and review; edited review drafts; conducted data searches and extractions; rated risk of bias and data quality; conducted data analysis and synthesis.
KH: conceived the review together with JK and MF. Helped to draft the protocol; edited review drafts; conducted data extractions; rated risk of bias; data analysis and synthesis.
MF: conceived the review together with JK and KH. Helped to draft the protocol; edited review drafts; conducted data extractions; rated risk of bias; data analysis and synthesis.
Sources of support
Internal sources
Recovery Research Institute, Center for Addiction Medicine, Massachusetts General Hospital and Harvard Medical School, USA
John F. Kelly is supported in part also by the Elizabeth R. Spallin Professorship in the Field of Addiction Medicine at Havard Medical School, USA
External sources
-
John F. Kelly was funded in part by a career award from the National Institute on Alcohol Abuse and Alcoholism (NIAAA) K24 AA022136, USA
This award (K24) from NIAAA partially covers Professor Kelly's time to work on recovery‐related research on treatment and recovery support services for alcohol use disorder.
Keith Humphreys was funded by a Senior Research Career Scientist Award from the U.S. Veterans Health Administration, and, the Esther Ting Memorial Professorship at Stanford, USA
Declarations of interest
JK: has received funding from the US National Institues of Health and the US Veterans Health Administration to conduct research into alcohol use disorders, comorbidities, treatment response, and mechanisms of behavior change in Alcoholics Anonymous (AA) and Self‐Management and Recovery Training (SMART).
KH: has received funding from the US National Institutes of Health and US Veterans Health Administration to evaluate a range of treatments and mutual‐help organizations focused on alcohol and other drugs.
MF: none known
Edited (no change to conclusions)
References
References to studies included in this review
Blondell 2001 {published data only}
- Blondell RD, Looney SW, Northington AP, Lasch ME, Rhodes SB, McDaniels RL. Using recovering alcoholics to help hospitalized patients with alcohol problems. Journal of Family Practice 2001;50(5):1-15. [PubMed] [Google Scholar]
Blondell 2011 {published data only}
- Blondell RD, Frydrych LM, Jaanimaqi U, Ashrafioun L, Homish GG, Foschio EM, et al. A randomized trial of two behavioral interventions to improve outcomes following inpatient detoxification for alcohol dependence. Journal of Addictive Diseases 2011;30(2):136-48. [DOI: 10.1080/10550887.2011.554777] [DOI] [PMC free article] [PubMed] [Google Scholar]
Bogenschutz 2014 {published data only}
- Bogenschutz MP, Rice SL, Tonigan JS, Vogel HS, Nowinski J, Hume D, et al. 12-step facilitation for the dually diagnosed: a randomized clinical trial. Journal of Substance Abuse Treatment 2014;46(4):403-11. [DOI: 10.1016/j.jsat.2013.12.009] [DOI] [PMC free article] [PubMed] [Google Scholar]
Bowen 2014 {published data only}
- Bowen S, Witkiewitz K, Clifasefi SL, Grow J, Chawla N, Hsu SH, et al. Relative efficacy of mindfulness-based relapse prevention, standard relapse prevention, and treatment as usual for substance use disorders: a randomized clinical trial. JAMA Psychiatry 2014;71(5):547-56. [DOI: 10.1001/jamapsychiatry.2013.4546] [DOI] [PMC free article] [PubMed] [Google Scholar]
Brooks 2003 {published data only}
- Brooks AJ, Penn PE. Comparing treatments for dual diagnosis: twelve-step and self-management and recovery training. American Journal of Drug and Alcohol Abuse 2003;29(2):359-83. [DOI: 10.1081/ADA-120020519] [DOI] [PubMed] [Google Scholar]
Brown 2002 {published data only}
- Brown TG, Seraganian P, Tremlay J, Annis H. Process and outcome changes with relapse prevention versus 12-step aftercare programs for substance abusers. Addiction 2002;976(6):677-89. [DOI] [PubMed] [Google Scholar]
Davis 2002 {published data only}
- Davis WT, Campbell L, Tax J, Lieber CS. A trial of 'standard' outpatient alcoholism treatment vs. a minimal treatment control. Journal of Substance Abuse Treatment 2002;23(1):9-19. [DOI: 10.1016/S0740-5472(02)00227-1] [DOI] [PubMed] [Google Scholar]
Grant 2018 {published data only}
- Grant KM, Young LB, Tyler KA, Simpson JL, Pulido RD, Timko C. Intensive referral to mutual-help groups: a field trial of adaptations for rural veterans. Patient Education and Counseling 2018;101(1):79-84. [DOI: 10.1016/j.pec.2017.07.012] [DOI] [PMC free article] [PubMed] [Google Scholar]
Herman 2000 {published data only}
- Herman SE, Frank KA, Mowbray CT, Ribisl KM, Davidson WS 2nd, Boots Miller B, et al. Longitudinal effects of integrated treatment on alcohol use for persons with serious mental illness and substance use disorders. Journal of Behavioral Health Services & Research 2000;27(3):286-302. [DOI: ] [DOI] [PubMed] [Google Scholar]
Humphreys 1996 {published data only}
- Humphreys K, Moos RH. Reduced substance-abuse-related health care costs among voluntary participants in Alcoholics Anonymous. Psychiatric Services 1996;47(7):709-13. [DOI: 10.1176/ps.47.7.709] [DOI] [PubMed] [Google Scholar]
Kahler 2004 {published data only}
- Kahler CW, Read JP, Ramsey SE, Stuart GL, McCrady BS, Brown RA. Motivational enhancement for 12-step involvement among patients undergoing alcohol detoxification. Journal of Consulting and Clinical Psychology 2004;72(4):736-41. [DOI: 10.1037/0022-006X.72.4.736] [DOI] [PubMed] [Google Scholar]
Kaskutas 2009b {published data only}
- Kaskutas LA, Subbaraman MS, Witbrodt J, Zemore SE. Effectiveness of making alcoholics anonymous easier: a group format 12-step facilitation approach. Journal of Substance Abuse Treatment 2009;37(3):228-39. [DOI: 10.1016/j.jsat.2009.01.004] [DOI] [PMC free article] [PubMed] [Google Scholar]
Kelly 2017b {published data only}
- Kelly JF, Kaminer Y, Kahler CW, Hoeppner B, Yeterian J, Cristello JV, et al. A pilot randomized clinical trial testing integrated 12‐step facilitation (iTSF) treatment for adolescent substance use disorder. Addiction 2017;112(12):2155-66. [DOI: 10.1111/add.13920] [DOI] [PMC free article] [PubMed] [Google Scholar]
Litt 2007 {published data only}
- *.Litt MD, Kadden RM, Kabela-Cormier E, Petry N. Changing network support for drinking: initial findings from the network support project. Journal of Consulting and Clinical Psychology 2007;75(4):542-55. [DOI: 10.1037/0022-006X.75.4.542] [DOI] [PubMed] [Google Scholar]
- Litt MD, Kadden RM, Kabela-Cormier E, Petry NM. Changing network support for drinking: Network Support Project 2-year follow-up. Journal of Consulting and Clinical Psychology 2009;77(2):229-42. [DOI: 10.1037/a0015252] [DOI] [PMC free article] [PubMed] [Google Scholar]
Litt 2016 {published data only}
- Litt MD, Kadden RM, Tennen H, Kabela-Cormier E. Network Support II: randomized controlled trial of Network Support treatment and cognitive behavioral therapy for alcohol use disorder. Drug and Alcohol Dependence 2016;165:203-12. [DOI: 10.1016/j.drugalcdep.2016.06.010] [DOI] [PMC free article] [PubMed] [Google Scholar]
Lydecker 2010 {published data only}
- Lydecker KP, Tate SR, Cummins KM, McQuaid J, Granholm E, Brown SA. Clinical outcomes of an integrated treatment for depression and substance use disorders. Psychology of Addictive Behaviors 2010;24(3):453-65. [DOI: 10.1037/a0019943] [DOI] [PMC free article] [PubMed] [Google Scholar]
Manning 2012 {published data only}
- Manning V, Best D, Faulkner N, Titherington E, Morinan A, Keaney F, et al. Does active referral by a doctor or 12-step peer improve 12-step meeting attendance? Results from a pilot randomised control trial. Drug and Alcohol Dependence 2012;126(1-2):131-7. [DOI: 10.1016/j.drugalcdep.2012.05.004] [DOI] [PubMed] [Google Scholar]
MATCH 1997 {published data only}
- Holder HD, Cisler RA, Longabaugh R, Stout RL, Treno AJ, Zweben A. Alcoholism treatment and medical care costs from Project MATCH. Addiction 2000;95(7):999-1013. [DOI: 10.1046/j.1360-0443.2000.9579993.x] [DOI] [PubMed] [Google Scholar]
- Longabaugh R, Wirtz PW, Zweben A, Stout RL. Network support for drinking, Alcoholics Anonymous and long-term matching effects. Addiction 1998;93(9):1313-33. [DOI: 10.1046/j.1360-0443.1998.93913133.x] [DOI] [PubMed] [Google Scholar]
- *.Project MATCH Research Group. Matching alcoholism treatments to client heterogeneity: Project MATCH posttreatment drinking outcomes. Journal of Studies on Alcohol and Drugs 1997;58(1):7-29. [PubMed] [Google Scholar]
- Project MATCH Research Group. Matching alcoholism treatments to client heterogeneity: Project MATCH three-year drinking outcomes. Alcoholism: Clinical and Experimental Research 1998;22(6):1300-11. [DOI: 10.1111/j.1530-0277.1998.tb03912.x] [DOI] [PubMed] [Google Scholar]
- Project MATCH Research Group. Matching alcoholism treatments to client heterogeneity: treatment main effects and matching effects on drinking during treatment. 1998 Journal of Studies on Alcohol and Drugs;59(6):631-9. [DOI: 10.15288/jsa.1998.59.631] [DOI] [PubMed] [Google Scholar]
McCrady 1996 {published data only}
- *.McCrady BS, Epstein EE, Hirsch LS. Issues in the implementation of a randomized clinical trial that includes Alcoholics Anonymous: studying AA-related behaviors during treatment. Journal of Studies on Alcohol and Drugs 1996;57(6):604-12. [DOI: 10.15288/jsa.1996.57.604] [DOI] [PubMed] [Google Scholar]
- McCrady BS, Epstein EE, Hirsch LS. Maintaining change after conjoint behavioral alcohol treatment for men: Outcomes at 6 months. Addiction 1999;94(9):1381-96. [DOI: 10.1046/j.1360-0443.1999.949138110.x] [DOI] [PubMed] [Google Scholar]
- McCrady BS, Epstein EE, Kahler CW. Alcoholics Anonymous and relapse prevention as maintenance strategies after conjoint behavioral alcohol treatment for men: 18-Month outcomes. Journal of Consulting and Clinical Psychology 2004;72(5):870-8. [DOI: 10.1037/0022-006X.72.5.870] [DOI] [PubMed] [Google Scholar]
Mundt 2012 {published data only}
- Mundt MP, Parthasarathy S, Chi FW, Sterling S, Campbell CI. 12-step participation reduces medical use costs among adolescents with a history of alcohol and other drug treatment. Drug and Alcohol Dependence 2012;126(1-2):124-30. [DOI: 10.1016/j.drugalcdep.2012.05.002] [DOI] [PMC free article] [PubMed] [Google Scholar]
Ouimette 1997 {published data only}
- Humphreys K, Moos R. Can encouraging substance abuse patients to participate in self-help groups reduce demand for health care? A quasi-experimental study. Alcoholism: Clinical and Experimental Research 2001;25(5):711-16. [PubMed] [Google Scholar]
- Humphreys K, Moos RH. Encouraging posttreatment self-help group involvement to reduce demand for continuing care services: two-year clinical and utilization outcomes. Alcohlism: Clinical and Experimental Research 2007;31(1):64-8. [DOI: 10.1111/j.1530-0277.2006.00273.x] [DOI] [PubMed] [Google Scholar]
- *.Ouimette PC, Finney JW, Moos RH. Twelve-step and cognitive-behavioral treatment for substance abuse: A comparison of treatment effectiveness. Journal of Consulting and Clinical Psychology 1997;65(2):230-40. [DOI: 10.1037//0022-006X.65.2.230] [DOI] [PubMed] [Google Scholar]
Timko 2006 {published data only}
- Timko C, DeBenedetti A. A randomized controlled trial of intensive referral to 12-step self-help groups: One-year outcomes. Drug and Alcohol Dependence 2007;90(2-3):270-9. [DOI] [PubMed] [Google Scholar]
- *.Timko C, Debenedetti A, Billow R. Intensive referral to 12-step self-help groups and 6-month substance use disorder outcomes. Addiction 2006;101(5):678-88. [DOI: 10.1111/j.1360-0443.2006.01391.x] [DOI] [PubMed] [Google Scholar]
Timko 2011 {published data only}
- Timko C, Sutkowi A, Cronkite RC, Makin-Byrd K, Moos RH. Intensive referral to 12-step dual-focused mutual-help groups. Drug and Alcohol Dependence 2011;118(2-3):194-201. [DOI: 10.1016/j.drugalcdep.2011.03.019] [DOI] [PubMed] [Google Scholar]
Vederhus 2014 {published data only}
- Vederhus JK, Timko C, Kristensen O, Hjemdahl B, Clausen T. Motivational intervention to enhance post‐detoxification 12‐step group affiliation: a randomized controlled trial. Addiction 2014;109(5):766-73. [DOI: 10.1111/add.12471] [DOI] [PMC free article] [PubMed] [Google Scholar]
Walitzer 2009 {published data only}
- Walitzer KS, Dermen KH, Barrick C. Facilitating involvement in alcoholics anonymous during out-patient treatment: A randomized clinical trial. Addiction 2009;104(3):391-401. [DOI: 10.1111/j.1360-0443.2008.02467.x] [DOI] [PMC free article] [PubMed] [Google Scholar]
Walitzer 2015 {published data only}
- Walitzer KS, Deffenbacher JL, Shyhalla K. Alcohol-adapted anger management treatment: a randomized controlled trial of an innovative therapy for alcohol dependence. Journal of Substance Abuse Treatment 2015;59:83-93. [DOI: 10.1016/j.jsat.2015.08.003] [DOI] [PMC free article] [PubMed] [Google Scholar]
Zemore 2018 {published data only}
- Zemore SE, Lui C, Mericle A, Hemberg J, Kaskutas LA. A longitudinal study of the comparative efficacy of Women for Sobriety, LifeRing, SMART Recovery, and 12-step groups for those with AUD. Journal of Substance Abuse Treatment 2018;88:18-26. [DOI: 10.1016/j.jsat.2018.02.004] [DOI] [PMC free article] [PubMed] [Google Scholar]
References to studies excluded from this review
Banerjee 2007 {published data only}
- Banerjee K, Howard M, Mansheim K, Beattie M. Comparison of Health Realization and 12-step treatment in women's residential substance abuse treatment programs. American Journal of Drug and Alcohol Abuse 2007;33(2):207-15. [DOI: 10.1080/00952990601174758] [DOI] [PubMed] [Google Scholar]
Hailemariam 2018 {published data only}
- Hailemariam M, Stein M, Anderson B, Schonbrun YC, Moore K, Kurth M, et al. Correlates of alcoholics anonymous affiliation among justice-involved women. BMC Women's Health 2018;18(1):125. [DOI: 10.1186/s12905-018-0614-0] [DOI] [PMC free article] [PubMed] [Google Scholar]
Lash 2011 {published data only}
- Lash SJ, Timko C, Curran GM, McKay JR, Burden JL. Implementation of evidence-based substance use disorder continuing care interventions. Psychology of Addictive Behaviors 2011;25(2):238-51. [DOI: 10.1037/a0022608] [DOI] [PMC free article] [PubMed] [Google Scholar]
Lash 2013 {published data only}
- Lash SJ, Burden JL, Parker JD, Stephens RS, Budney AJ, Horner RD, et al. Contracting, prompting and reinforcing substance use disorder continuing care. Journal of Substance Abuse Treatment 2013;44(4):449-56. [DOI: 10.1016/j.jsat.2012.09.008] [DOI] [PubMed] [Google Scholar]
Laudet 2007 {published data only}
- Laudet A, Stanick V, Sands B. An exploration of the effect of on-site 12-step meetings on post-treatment outcomes among polysubstance-dependent outpatient clients. Evaluation Review 2007;31(6):613-43. [DOI: 10.1177/0193841X07306745] [DOI] [PMC free article] [PubMed] [Google Scholar]
Moos 1999 {published data only}
- Moos RH, Moos BS, Andrassy JM. Outcomes of four treatment approaches in community residential programs for patients with substance use disorders. Psychiatry Services 1999;50(12):1577-83. [DOI: 10.1176/ps.50.12.1577] [DOI] [PubMed] [Google Scholar]
Morgan‐Lopez 2013 {published data only}
- Morgan-Lopez AA, Saavedra LM, Hien DA, Campbell AN, Wu E, Ruglass L. Synergy between seeking safety and twelve-step affiliation on substance use outcomes for women. Journal of Substance Abuse Treatment 2013;45(2):179-89. [DOI: 10.1016/j.jsat.2013.01.015] [DOI] [PMC free article] [PubMed] [Google Scholar]
Mueller 2007 {published data only}
- Mueller SE, Petitjean S, Boening J, Wiezbeck GA. The impact of self-help group attendance on relapse rates after alcohol detoxification in a controlled study. Alcohol and Alcoholism 2007;42(2):108-12. [DOI: 10.1093/alcalc/agl122] [DOI] [PubMed] [Google Scholar]
Schilling 2002 {published data only}
- Schilling RF, El-Bassel N, Finch JB, Roman RJ, Hanson M. Motivational interviewing to encourage self-help participation following alcohol detoxification. Research on Social Work Practice 2002;12(6):711-30. [DOI: 10.1177/104973102237469] [DOI] [Google Scholar]
Ståhlbrandt 2007 {published data only}
- Ståhlbrandt H, Johnsson KO, Berglund M. Two-year outcome of alcohol interventions in Swedish university halls of residence: a cluster randomized trial of a brief skills training program, twelve-step-influenced intervention, and controls. Alcoholism: Clinical and Experimental Research 2007;31(3):458-66. [DOI: 10.1111/j.1530-0277.2006.00327.x] [DOI] [PubMed] [Google Scholar]
Tonigan 2010 {published data only}
- Tonigan JS, Book SW, Pagano ME, Randall PK, Smith JP, Randall CL. 12-step therapy and women with and without social phobia: a study of the effectiveness of 12-step therapy to facilitate alcoholics anonymous engagement. Alcoholism Treatment Quarterly 2010;28(2):151-62. [DOI: 10.1080/07347321003648596] [DOI] [PMC free article] [PubMed] [Google Scholar]
Villanueva 2007 {published data only}
- Villanueva M, Tonigan JS, Miller WR. Response of Native American clients to three treatment methods for alcohol dependence. Journal of Ethnicity in Substance Abuse 2007;6(2):41-8. [DOI: doi: 10.1300/J233v06n02_04] [DOI] [PubMed] [Google Scholar]
Walsh 1991 {published data only}
- Walsh DC, Hingson RW, Merrigan DM, Levenson SM, Cupples LA, Heeren T, et al. A randomized trial of treatment options for alcohol-abusing workers. New England Journal of Medicine 1991;325(11):775-82. [DOI: 10.1056/NEJM199109123251105] [DOI] [PubMed] [Google Scholar]
Additional references
Alcoholics Anonymous 2001
- Alcoholics Anonymous. Alcoholics Anonymous: The Story of How Thousands of Men and Women have Recovered from Alcoholism. 4th edition. New York (NY): Alcoholics Anonymous World Services, 2001. [Google Scholar]
Alcoholics Anonymous 2018
- Alcoholics Anonymous. One Big Tent. New York (NY): AA Grapevine, Inc, 2018. [Google Scholar]
APA 1994
- American Psychiatric Association. Diagnostic and Statistical Manual of Mental Disorders. 4th edition. Washington (DC): American Psychiatric Association, 1994. [Google Scholar]
APA 2013
- American Psychiatric Association. Diagnostic and Statistical Manual of Mental Disorders. 5th edition. Washington (DC): American Psychiatric Association, 2013. [Google Scholar]
Bøg 2017
- Bøg M, Filges T, Brännström L, Jørgensen AM, Fredriksson MK. 12-step programs for reducing illicit drug use: a systematic review. Cambell Systematic Reviews 2017;2. [DOI: 10.4073/csr.2017.2] [DOI]
Caetano 1998
- Caetano R, Clark CL, Greenfield TK. Prevalence, trends, and incidence of alcohol withdrawal symptoms: analysis of general population and clinical samples. Alcohol Health and Research World 1998;22(1):73-9. [PMC free article] [PubMed] [Google Scholar]
Drummond 2005
- Drummond MF, Sculpher MJ, Torrance GW, O'Brien BJ, Stoddart GL. Methods for the Economic Evaluation of Health Care Programmes. 3rd edition. Oxford (UK): Oxford University Press, 2005. [Google Scholar]
Ducharme 2006
- Ducharme LJ, Knudsen HK, Roman PM. Trends in the adoption of medication for alcohol dependence. Journal of Clinical Psychopharmacology 2006;26(6):S13-9. [DOI: 10.1097/01.jcp.0000246209.18777.14] [DOI] [PubMed] [Google Scholar]
Dunn 1997
- Dunn CW, Donovan DM, Gentilello LM. Practical guidelines for performing alcohol interventions in trauma centers. Journal of Trauma: Injury, Infection, and Critical Care 1997;42(2):299-304. [DOI] [PubMed] [Google Scholar]
Evers 2005
- Evers S, Goossens M, Vet H, Tulder M, Ament A. Criteria list for assessment of methodological quality of economic evaluations: Consensus on Health Economic Criteria. International Journal of Technology Assessment in Health Care 2005;21(2):240-5. [PubMed] [Google Scholar]
GRADEpro GDT 2015 [Computer program]
- GRADEpro GDT. Hamilton (ON): GRADE Working Group, McMaster University, 2015. Available at gradepro.org.
Hedden 2015
- Hedden SL, Kennet J, Lipari R, Medley G, Tice P, Copello EA, et al, SAMHSA. Behavioral health trends in the United States: results from the 2014 National Survey on Drug Use and Health. www.samhsa.gov/data/sites/default/files/NSDUH-FRR1-2014/NSDUH-FRR1-2014.pdf (accessed prior to 25 November 2019).
Herman 1997
- Herman SE, BootsMiller B, Jordan L, Mowbray CT, Brown WG, Deiz N, et al. Immediate outcomes of substance use treatment within a state psychiatric hospital. Journal of Mental Health Administration 1197;24(2):126-38. [DOI] [PubMed] [Google Scholar]
Higgins 2011a
- Higgins JP, Green S, editor(s). Cochrane Handbook for Systematic Reviews of Interventions. Version 5.1.0 (updated March 2011). The Cochrane Collaboration, 2011. Available from handbook.cochrane.org.
Higgins 2011b
- Higgins JP, Deeks JJ, Altman DG, editor(s). Chapter 16: Special topics in statistics. In: Higgins JP, Green S, editor(s). Cochrane Handbook for Systematic Reviews of Interventions Version 5.1.0 (updated March 2011). The Cochrane Collaboration, 2011. Available from handbook.cochrane.org.
Hoffman 2009
- Hoffman F. Cultural adaptations of Alcoholics Anonymous to serve Hispanic populations. International Journal of the Addictions 2009;29(4):445-60. [DOI: ] [DOI] [PubMed] [Google Scholar]
Holder 2000
- Holder HD, Cisler RA, Longabaugh R, Stout RL, Treno AJ, Zweben A. Alcoholism treatment and medical care costs from Project MATCH. Addiction 2000;95(7):999-1013. [10.1046/j.1360-0443.2000.9579993.x] [DOI] [PubMed] [Google Scholar]
Humphreys 1994
- Humphreys K, Mavis BE, Stöffelmayr BE. Are twelve step programs appropriate for disenfranchised groups? Evidence from a study of posttreatment mutual help group involvement. Prevention in Human Services 1994;11(1):165-80. [Google Scholar]
Humphreys 1999
- Humphreys K. Professional interventions that facilitate 12-step self-help group involvement. Alcohol Health and Research World 1999;23(2):93-8. [PMC free article] [PubMed] [Google Scholar]
Humphreys 2001
- Humphreys K, Moos R. Can encouraging substance abuse patients to participate in self-help groups reduce demand for health care? A quasi-experimental study. Alcoholism: Clinical and Experimental Research 2001;25(5):711-6. [PubMed] [Google Scholar]
Humphreys 2004
- Humphreys K. Circles of Recovery: Self-Help Organizations for Addictions. Cambridge, UK: Cambridge University Press, 2004. [Google Scholar]
Humphreys 2007
- Humphreys K, Moos RH. Encouraging posttreatment self-help group involvement to reduce demand for continuing care services: two-year clinical and utilization outcomes. Alcohlism: Clinical and Experimental Research 2007;31(1):64-8. [DOI: 10.1111/j.1530-0277.2006.00273.x] [DOI] [PubMed] [Google Scholar]
Humphreys 2014
- Humphreys K, Blodgett JC, Wagner TH. Estimating the efficacy of Alcoholics Anonymous without self-selection bias: an instrumental variables re-analysis of randomized clinical trials. Alcoholism, Clinical and Experimental Research 2014;38(11):2688-94. [DOI: 10.1111/acer.12557] [DOI] [PMC free article] [PubMed] [Google Scholar]
Jilek‐Aall 1981
- Jilek-Aall L. Acculturation, alcoholism, and Indian-style Alcoholics Anonymous. Journal of Studies on Alcohol, Supplement 1981;S9:143-58. [DOI: ] [DOI] [PubMed] [Google Scholar]
Kaskutas 2009a
- Kaskutas LA. Alcoholics Anonymous effectiveness: faith meets science. Journal of Addictive Diseases 2009;28(2):145-57. [DOI: 10.1080/10550880902772464] [DOI] [PMC free article] [PubMed] [Google Scholar]
Kelly 2003a
- Kelly JF, McKellar JD, Moos RH. Major depression in patients with substance use disorders: Relationships to 12-step self-help involvement and substance use outcomes. Addiction 2003;98(4):499-508. [DOI] [PubMed] [Google Scholar]
Kelly 2003b
- Kelly JF. Self-help for substance-use disorders: history, effectiveness, knowledge gaps, and research opportunities. Clinical Psychology Review 2003;23(5):639-663. [DOI: 10.1016/S0272-7358(03)00053-9] [DOI] [PubMed] [Google Scholar]
Kelly 2009a
- Kelly JF, McCrady BS. Twelve-step facilitation in non-specialty settings. In: Research on alcoholism: Alcoholics Anonymous and spiritual aspects of recovery. New York, NY: Springer, 2009:797-836. [Google Scholar]
Kelly 2009b
- Kelly JF, Magill M, Stout RL. How do people recover from alcohol dependence? A systematic review of the research on mechanisms of behavior change in Alcoholics Anonymous. Addiction Research & Theory 2009;17(3):236-59. [http://dx.doi.org/10.1080/16066350902770458] [Google Scholar]
Kelly 2012
- Kelly JF, White WL. Broadening the base of addiction mutual-help organizations. Journal of Groups in Addiction and Recover 2012;7(2-4):82-101. [DOI: ] [Google Scholar]
Kelly 2013a
- Kelly JK, Yeterian J. Mutual-help groups for alcohol and other substance use disorders. In: McCrady BS, Epstein EE, editors(s). Addictions: A Comprehensive Guidebook. 2nd edition. New York, NY: Oxford University Press, 2013:500-25. [Google Scholar]
Kelly 2013b
- Kelly JF, Greene MC. The twelve promises of Alcoholics Anonymous: psychometric validation and mediational testing as a 12-step specific mechanism of behavior change. Drug and Alcohol Dependence 2013;133(2):633-40. [DOI: 10.1016/j.drugalcdep.2013.08.006] [DOI] [PMC free article] [PubMed] [Google Scholar]
Kelly 2013c
- Kelly JF, Humphreys K, Yeterian J. Mutual-Help Groups. In: Herie M, Skinner WJW, editors(s). Fundamentals of Addiction: A Practical Guide for Counsellors. Toronto (ON): Centre on Addiction and Mental Health, 2013:321-48. [Google Scholar]
Kelly 2014
- Kelly JF, Greene MC, Bergman BG. Do drug dependent patients attending Alcoholics Anonymous rather than Narcotics Anonymous do as well? A prospective, lagged, matching analysis. Alcohol and Alcoholism 2014;49(6):645-53. [DOI: ] [DOI] [PMC free article] [PubMed] [Google Scholar]
Kelly 2017a
- Kelly J. Is Alcoholics Anonymous religious, spiritual, neither? Findings from 25 years of mechanisms of behavior change research. Addiction 2017;112(6):929-36. [DOI: 10.1111/add.13590] [DOI] [PMC free article] [PubMed] [Google Scholar]
Kelly 2018
- Kelly JF, Greene MC, Bergman BG. Beyond abstinence: changes in indices of quality of life with time in recovery in a nationally representative sample of U.S. adults. Alcoholism: Clinical and Experimental Research 2018;42(4):770-80. [DOI: 10.1111/acer.13604] [DOI] [PMC free article] [PubMed] [Google Scholar]
Knudsen 2016
- Knudsen HK, Roman PM. Service delivery and pharmacotherapy for alcohol use disorder in the era of health reform: data from a national sample of treatment organizations. Substance Abuse 2016;37(1):230-7. [DOI: 10.1080/08897077.2015.1028699] [DOI] [PMC free article] [PubMed] [Google Scholar]
Liberati 2009
- Liberati A, Altman DG, Tetzlaff J, Mulrow C, Gotzsche PC, Ioannidis JP, et al. The PRISMA statement for reporting systematic reviews and meta-analyses of studies that evaluate health care interventions: explanation and elaboration. PLoS Medicine 2009;6(7):e1000100. [DOI] [PMC free article] [PubMed] [Google Scholar]
Longabaugh 1998
- Longabaugh R, Wirtz PW, Zweben A, Stout RL. Network support for drinking, Alcoholics Anonymous and long-term matching effects. Addiction 1998;93(9):1313-33. [DOI: 10.1046/j.1360-0443.1998.93913133.x]] [DOI] [PubMed] [Google Scholar]
Mann 2006a
- Mann RE, Zalcman RF, Smart RG, Rush BR, Suurvali H. Alcohol consumption, alcoholics anonymous membership, and homicide mortality rates in Ontario 1968 to 1991. Alcoholism: Clinical and Experimental Research 2006;30(10):1743-51. [DOI: 10.1111/j.1530-0277.2006.00216.x] [DOI] [PubMed] [Google Scholar]
Mann 2006b
- Mann RE, Zalcman RF, Smart RG, Rush BR, Suurvali H. Alcohol consumption, alcoholics anonymous membership, and suicide mortality rates, Ontario, 1968-1991. Journal of Studies on Alcohol and Drugs 2006;67(3):445-53. [DOI] [PubMed] [Google Scholar]
Marlatt 1985
- Marlatt GA, Gordon JR. Relapse Prevention: Maintenance Strategies in the Treatment of Addictive Behaviors. New York (NY): Guilford Press, 1985. [Google Scholar]
MATCH 2001
- Project MATCH . Project MATCH hypotheses: results and causal chain analyses. In: Longabaugh R, Wirtz PW, Mattson ME, Myers JK, editors(s). National Institute on Alcohol Abuse and Alcoholism Project MATCH Monograph Series Volume 8. Vol. 8. Rockville, MD: U.S. Department of Health and Human Services, Public Health Service, National Institutes of Health, 2001. [Google Scholar]
McCrady 1993
- McCrady BS, Miller WR. Research on Alcoholics Anonymous: Opportunities and Alternatives. New Brunswick (NJ): Rutgers Center of Alcohol Studies, 1993. [Google Scholar]
McLellan 1980
- McLellan AT, Luborsky L, O’Brien CP, Woody GE. An improved diagnostic instrument for substance abuse patients: the addiction severity index. Journal of Nervous & Mental Diseases 1980;168(1):26-33. [DOI] [PubMed] [Google Scholar]
Miller 1995
- Miller WR, Tonigan JS, Longabaugh R. The Drinker Inventory of Consequences (DrInC): An Instrument for Assessing Adverse Consequences of Alcohol Abuse: Test Manual. Vol. 4, Project MATCH Monograph. Rockville, MD: National Institute on Alcohol Abuse and Alcoholism, 1995. [Google Scholar]
Moher 2009
- Moher D, Liberati A, Tetzlaff J, Altman DG, The PRISMA Group. Preferred reporting items for systematic reviews and meta-analyses: the PRISMA statement. PLos Medicine 2009;6(7):e1000097. [DOI: 10.1371/journal.pmed1000097] [DOI] [PMC free article] [PubMed] [Google Scholar]
OSG 2018
- US Department of Health and Human Services (HHS), Office of the Surgeon General. Facing addiction in America: the surgeon general’s spotlight on opioids. addiction.surgeongeneral.gov/sites/default/files/Spotlight-on-Opioids_09192018.pdf September 2018.
Room 2006
- Room R, Makela P, Schmidt L, Rehm J. Alcohol, Health Disparities and Development. www.robinroom.net/Alchealth.pdf (accessed 9 November 2017).
Rosenbaum 2015
- Rosenbaum BP, Kshettry VR, Kelly ML, Weil RJ. Diagnoses associated with the greatest years of potential life lost for in-hospital deaths in the United States, 1988-2010. Public Health 2015;129(2):173-81. [DOI: 10.1016/j.puhe.2014.11.011] [DOI] [PubMed] [Google Scholar]
Sacks 2015
- Sacks JJ, Gonzales KR, Bouchery EE, Tomedi LE, Brewer RD. 2010 National and State Costs of Excessive Alcohol Consumption. American Journal of Preventive Medicine 2015;49(5):e73-9. [DOI: ] [DOI] [PubMed] [Google Scholar]
Schunemann 2013
- Schunemann H, Brozek J, Guyatt G, Oxman A, editor(s). Handbook for grading the quality of evidence and the strength of recommendations using the GRADE approach (updated October 2013). GRADE Working Group, 2013. Available from gdt.guidelinedevelopment.org/app/handbook/handbook.html.
Shemilt 2011a
- Shemilt I, Mugford M, Byford S, Drummond M, Eisenstein E, Knapp M, et al. Chapter 15: Incorporating economics evidence. In: Higgins JP, Green S, editor(s). Cochrane Handbook for Systematic Reviews of Interventions Version 5.1.0 (updated March 2011). The Cochrane Collaboration, 2011. Available from handbook.cochrane.org.
Shemilt 2011b
- Shemilt I, Mugford M, Byford S, Drummond M, Eisenstein E, Knapp M, et al. Chapter 15: Incorporating economics evidence. In: Higgins JP, Green S, editor(s). Cochrane Handbook for Systematic Reviews of Interventions Version 5.1.0 (updated March 2011). The Cochrane Collaboration, 2011. Available from handbook.cochrane.org.
Stahre 2014
- Stahre M, Roeber J, Kanny D, Brewer R, Zhang X. Contribution of excessive alcohol consumption to deaths and years of potential life lost in the United States. Preventing Chronic Disease 2014;11:E109. [DOI: ] [DOI] [PMC free article] [PubMed] [Google Scholar]
Sterne 2011
- Sterne JAC, Egger M, Moher D (editors). Chapter 10: Addressing reporting biases. In: Higgins JPT, Green S (editors). Cochrane Handbook for Systematic Reviews of Intervention.. Available from handbook.cochrane.org.
Sterne 2016
- Sterne JA, Hernán MA, Reeves BC, Savović J, Berkman ND, Viswanathan M, et al. ROBINS-I: a tool for assessing risk of bias in non-randomized studies of interventions. BMJ 2016;355:i4919. [DOI: 10.1136/bmj.i4919.] [DOI] [PMC free article] [PubMed] [Google Scholar]
Tonigan 2018
- Tonigan JS, Pearson MR, Magill M, Hagler KJ. AA attendance and abstinence for dually diagnosed patients: a meta-analytic review. Addiction 2018;113(11):1970-81. [DOI: 10.1111/add.14268] [DOI] [PubMed] [Google Scholar]
White 2012
- White WL, Kelly JF, Roth JD. New addiction recovery support institutions: Mobilizing support beyond professional addiction treatment and recovery mutual aid. Journal of Groups in Addiction & Recovery 2012;7:297-317. [DOI: ] [Google Scholar]
WHO 2010
- World Health Organization. International Statistical Classification of Diseases and Related Health Problems: ICD-10. 10th edition. Vol. 2. Geneva: World Health Organization, 2010. [Google Scholar]
WHO 2014
- World Health Organization. Global Status Report on Alcohol and Health. Geneva, Switzerland: World Health Organization, 2014. [Google Scholar]
Yalom 2008
- Yalom ID, Leszcz M. The Theory and Practice of Group Psychotherapy. 5th edition. New York (NY): Basic Books, 2008. [Google Scholar]
Zemore 2004
- Zemore SE, Kaskutas LA, Ammon LN. In 12-step groups, helping helps the helper. Addiction 2004;99(8):1015-23. [DOI: 10.1111/j.1360-0443.2004.00782.x] [DOI] [PubMed] [Google Scholar]
Zemore 2017
- Zemore SE, Kaskutas LA, Mericle A, Hemberg J. Comparison of 12-step groups to mutual help alternatives for AUD in a large, national study: differences in membership characteristics and group participation, cohesion, and satisfaction. Journal of Substance Abuse Treatment 2017;73:16-26. [DOI: 10.1016/j.jsat.2016.10.004] [DOI] [PMC free article] [PubMed] [Google Scholar]
References to other published versions of this review
Ferri 2006a
- Ferri M, Amato L, Davoli M. 12-step programmes and Alcoholics Anonymous for alcohol dependence. Cochrane Database of Systematic Reviews 2004, Issue 4. Art. No: CD005032. [DOI: 10.1002/14651858.CD005032.pub2] [DOI] [PMC free article] [PubMed] [Google Scholar]
Ferri 2006b
- Ferri M, Amato L, Davoli M. Alcoholics Anonymous and other 12-step programmes for alcohol dependence. Cochrane Database of Systematic Reviews 2006, Issue 3. Art. No: CD005032. [DOI: 10.1002/14651858.CD005032.pub2] [DOI] [PMC free article] [PubMed] [Google Scholar]
Kelly 2017c
- Kelly JF, Humphreys K, Ferri M. Alcoholics Anonymous and other 12-step programs for alcohol use disorder. Cochrane Database of Systematic Reviews 2017, Issue 11. Art. No: CD012880. [DOI: 10.1002/14651858.CD012880] [DOI] [PMC free article] [PubMed] [Google Scholar]