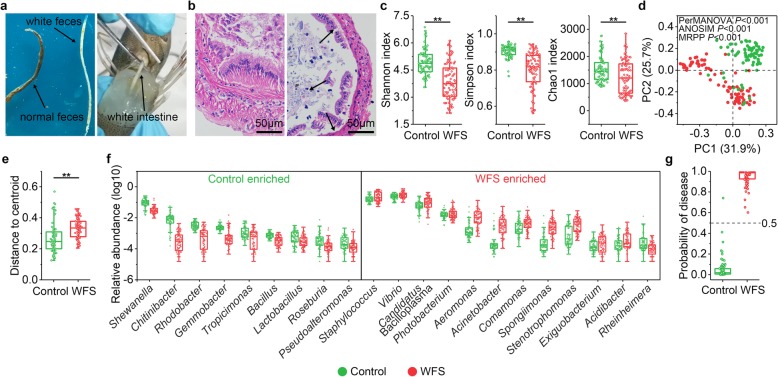
Fig. 1.
Characterization of the clinical signs, histological pathology, and microbial features of WFS. a The diseased shrimp excretes white feces. The intestine of WFS shrimp is distended and filled with white content. b Comparison of histological pathology of shrimp intestine with or without WFS signs. The black arrows point towards pathological features, including dropped epithelial cell, reduced or disappeared microvilli, and thinner mid intestine. c The α-diversity comparison between control group (n = 75) and WFS group (n = 84). Shannon index, P = 0.002; Simpson index, P < 0.001; Chao1 index, P = 0.002. Significant differences are indicated by asterisks (*, P < 0.05; **, P < 0.01). d Samples were clustered into two groups by PCoA based on Bray-Curtis distance. The microbial structure differed significantly between control group and WFS group confirmed by PerMANOVA (P < 0.001), ANOSIM (P < 0.001), and MRPP (P < 0.001). e Comparison of β-dispersion based on Bray-Curtis distance between Control and WFS, P = 0.008 (Student’s t-test). f Genera are strikingly different between control group and WFS group. The box plot shows that the relative abundance of ten genera were enriched in Control and the relative abundance of 11 genera were abundant in WFS. g The random forests model was conducted to predict the probability of disease (POD). The diagnosed probability of shrimp WFS was based on profiles of the disease-discriminatory taxa. The probability > 50% was stratified as WFS shrimp, while < 50% was stratified as control shrimp

