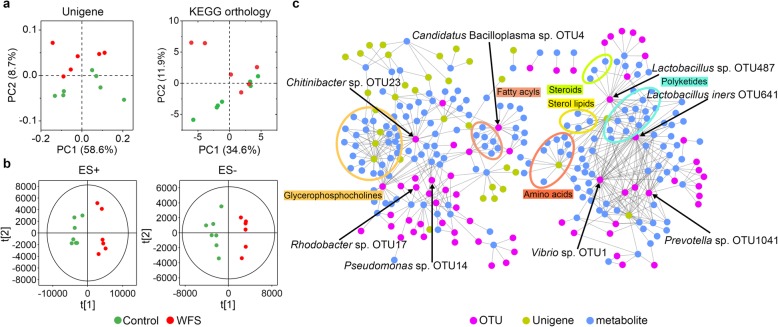
Fig. 2.
Comparative analysis of microbial gene functions and metabolic patterns between control and WFS. a PCoA based on the relative abundance of all Unigenes with Bray-Curtis distance and KEGG orthology groups. b OPLS-DA score plots based on the metabolic profiles in intestine samples from control group (n = 7) and WFS group (n = 6) in ES+ and ES− models. c Multiomics data integration for different categories. The relationship (edges) between OTUs (purple), Unigenes (olive) and metabolites (blue) between all samples is estimated by Spearman’s correlation analysis. And those with low correlated (|r| < 0.7) are not shown

