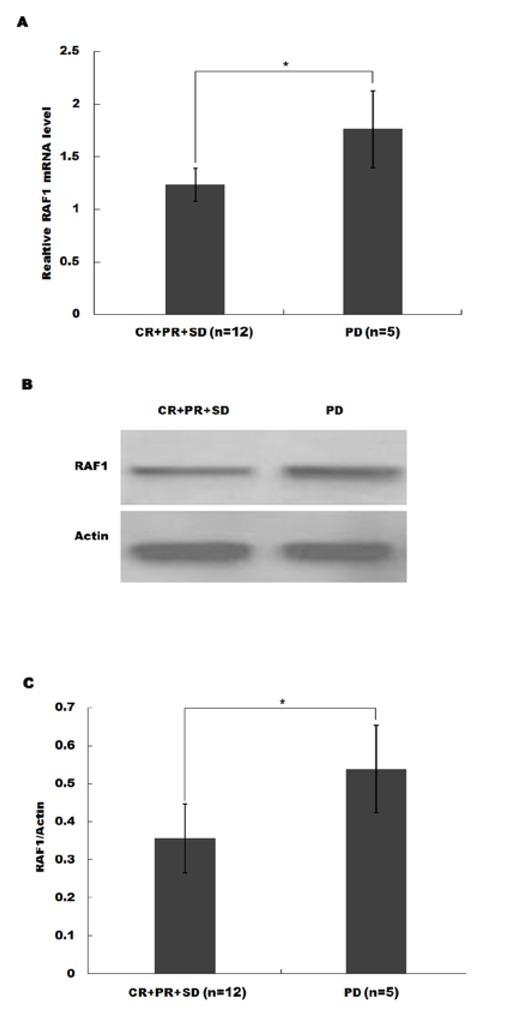
Figure 4.

The resistant sub-group (SD) had even higher expression of RAF1 mRNA (A) and protein (B-C) compared to the sensitive subgroup (CR+PR+SD). The HCC patients were divided into four populations according to different responses to sorafenib, which were the complete response (CR) group, the partial response (PR) group, the stable disease (SD) group, and the progressive disease (PD) group. ** p<0.01 HCC vs control.
