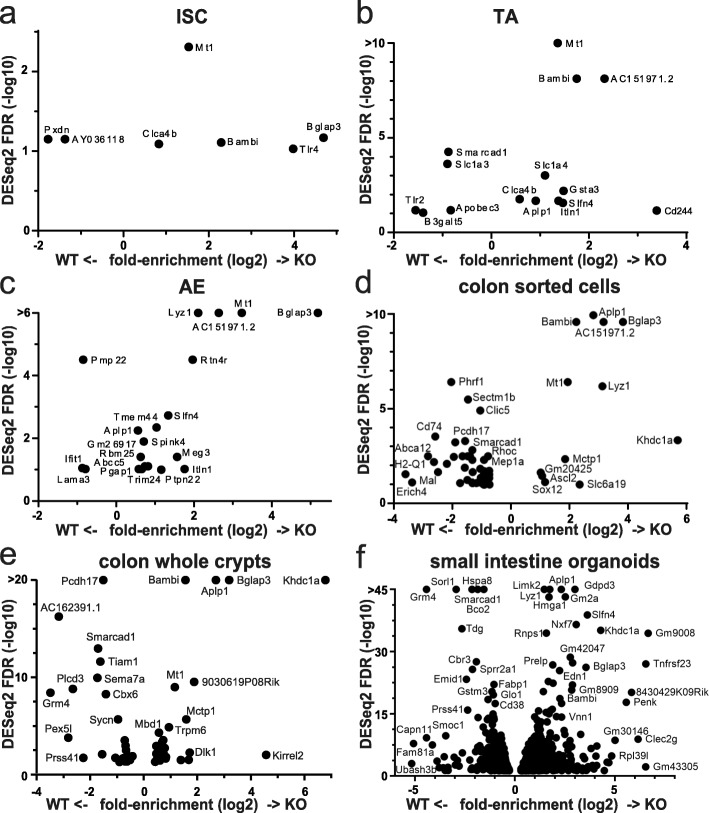
Fig. 2.
Gene expression changes on Smarcad1-KO. Significantly up/downregulated genes (DESeq2 test with cutoff FDR < 0.1 for a–d and FDR < 0.05 for e, f; for additional data and annotations, see Additional file 3: Table S2, Additional file 4: Table S3) in RNA-seq experiments (n = 3). X-axis: Smarcad1-KO/WT log (2) fold-enrichment of reads per transcript. Y-axis: -log (10) FDR. High FDR values capped at indicated maximum Y values for visualization. 0-expression values were set to 0.1 to allow log-plotting of fold changes. a Intestinal stem cells (ISC), FACS-selected by high Lgr5-GFP signal. b Transit amplifying cells (TA), FACS-selected by low Lgr5-GFP signal. c Adult enterocytes (AE), FACS-selected by EPCAM-positive and CD31/45-negative signal. d Colon epithelium, FACS-selected by EPCAM-positive and CD31/45-negative signal. e Colon epithelium, isolated as whole crypt suspension. f Small intestine-derived organoid culture

