Fig. 3.
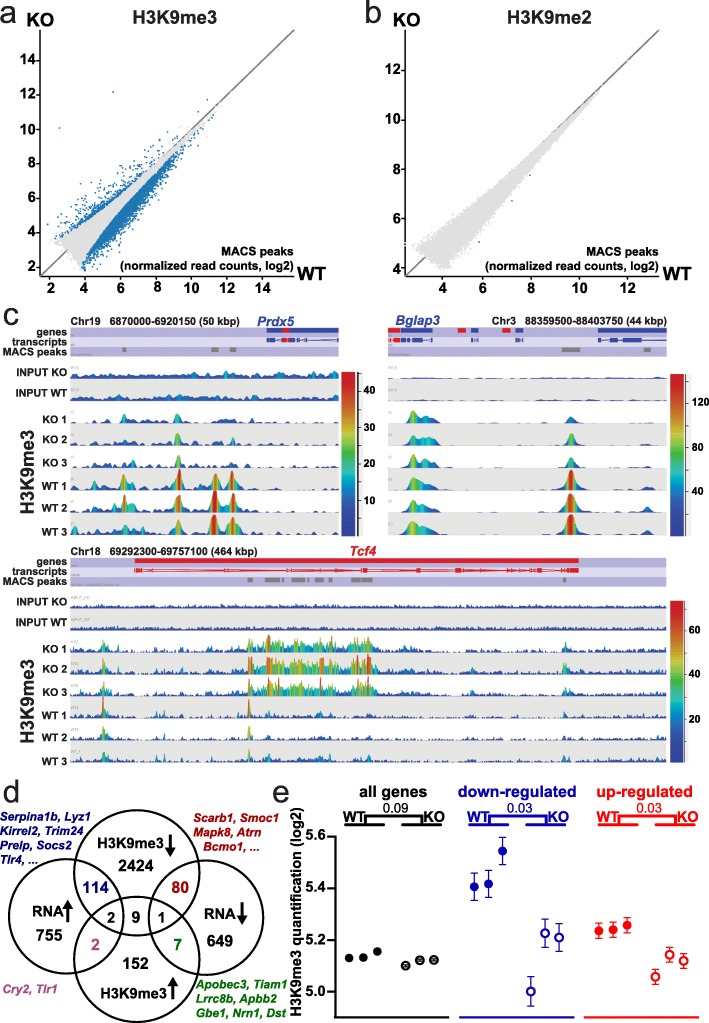
H3K9me2/3 changes linked to Smarcad1-KO in the small intestine. EdgeR analysis (p < 0.05) of read counts over H3K9me3 (a) or H3K9me2 (b) peaks reveals regions with significant alterations in these histone marks on deletion of Smarcad1 in the small intestinal epithelium by Vil-cre (KO). Datasets shown as averaged from 3 replicates (for additional data and annotations, see Additional file 6: Tables S5, Additional file 7: Table S6). c Examples of H3K9me3 changes over selected regions. The top annotation tracks indicate genes, transcripts, and H3K9me3 MACS peaks. Read counts are shown in linear scale, color coded. Chromosomal positions and window sizes in kbp are indicated. d Link between changes in gene expression and changes in H3K9me3. Venn diagrams showing the distribution of differentially expressed genes (DEG) in small intestine organoids on Smarcad1-KO (see Additional file 1: Fig. S2a, Additional file 3: Table S2) and genes from small intestinal crypts with differential H3K9me3 MACS peaks within ± 5 kbp of the gene (EdgeR p < 0.05, see Additional file 6: Table S5). There is a significant overlap between genes with increased expression and decreased H3K9me3 (p = 0.00017, chi-square, number of expressed genes 25,965, Additional file 2: Table S1). The Venn diagrams are not drawn to scale. e Normalized H3K9me3 ChIP-seq read count quantitation over MACS peaks, log2 transformed, adjusted for matching distributions in SeqMonk. Separate quantitations over all annotated genes (32,029 genes) and ± 5 kbp up- and downstream of genes with up- and downregulated expression in small intestinal organoids on Smarcad1-KO (1420 genes, see Additional file 1, Fig. S2, Additional file 3: Table S2). p values from an unpaired two-tailed t test with Welch’s correction are indicated (n = 3). Error bars indicate the standard error of the mean (SEM) of read count quantitation of each biological replicate

