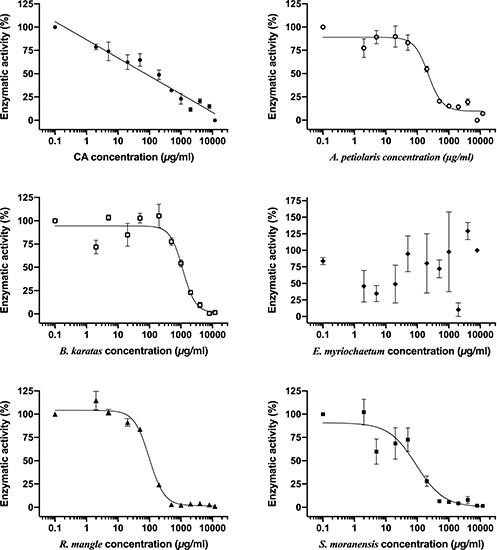
FIGURE 2.

Comparison of inhibitory concentration-response curves of chlorogenic acid and each plant extract on G6Pase system activity. Each point represents the mean of three replicates ± SEM. CA, chlorogenic acid.

Comparison of inhibitory concentration-response curves of chlorogenic acid and each plant extract on G6Pase system activity. Each point represents the mean of three replicates ± SEM. CA, chlorogenic acid.