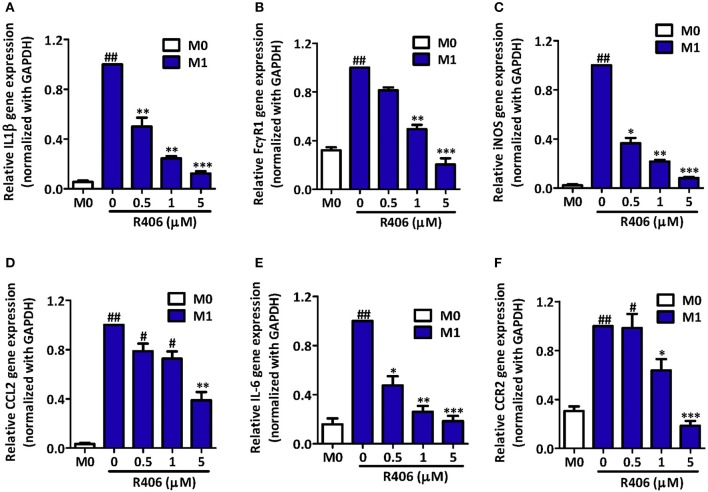
Figure 2.
Inhibition of M1-specific differentiation and inflammatory markers by R406 in RAW macrophages. Gene expression of M1 markers IL-1β (A); FcγR1 (B); iNOS (C); CCL2 (D); IL-6 (E); and CCR2 (F) in RAW 264.7 cells after incubation with medium alone (M0) or M1 stimulus with R406 (0, 0.5, 1, and 5 μM). Expression values for the respective genes in untreated M1 macrophages were set at 1.0 to calculate the relative gene expression. Data are presented as mean + SEM. #p < 0.05, ##p < 0.01 denotes significance versus control M0 macrophages. *p < 0.05, **p < 0.01, and ***p < 0.001 denotes significance versus M1-differentiated macrophages. Reproduced with permission (78).

