Figure 3.

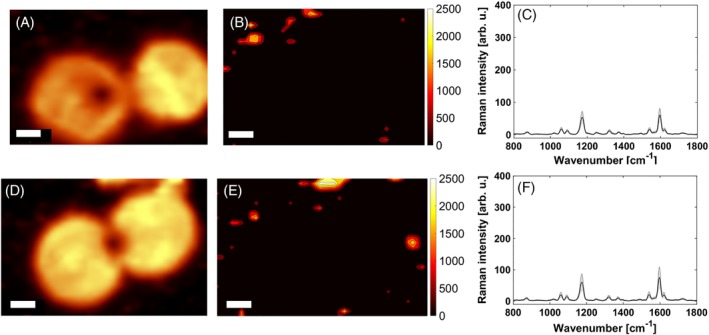
Visualization of the contributing low‐intensity pixels. A, D, Fluorescence images; B, E, false‐color images with reduced color scale bar; and C, F, mean SERS spectrum. Scale bar is 5 μm. SERS, surface‐enhanced Raman scattering

Visualization of the contributing low‐intensity pixels. A, D, Fluorescence images; B, E, false‐color images with reduced color scale bar; and C, F, mean SERS spectrum. Scale bar is 5 μm. SERS, surface‐enhanced Raman scattering