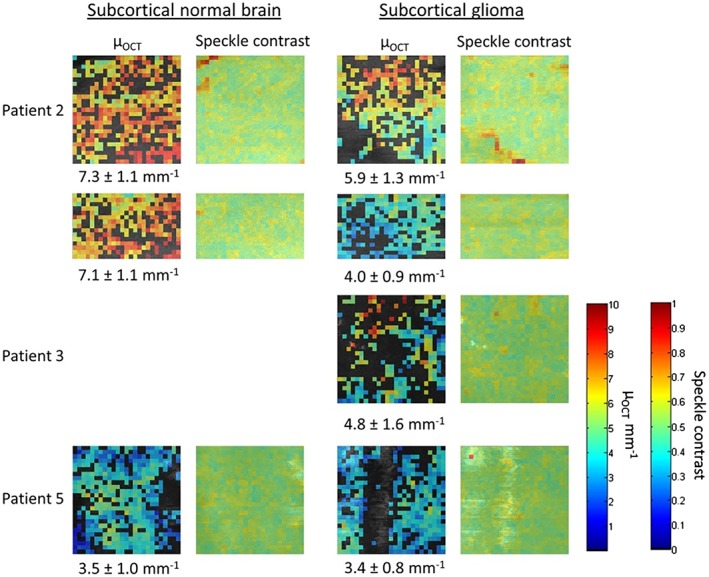
Figure 5.

Color map of speckle contrast and μOCT of the subcortical OCT datasets. The μOCT color scale bar runs from 0 to 10 mm−1 and the color scale bar of the speckle contrast runs from 0 to 1. The μOCT mean and standard deviation are given below the color maps
