
Figure 4.
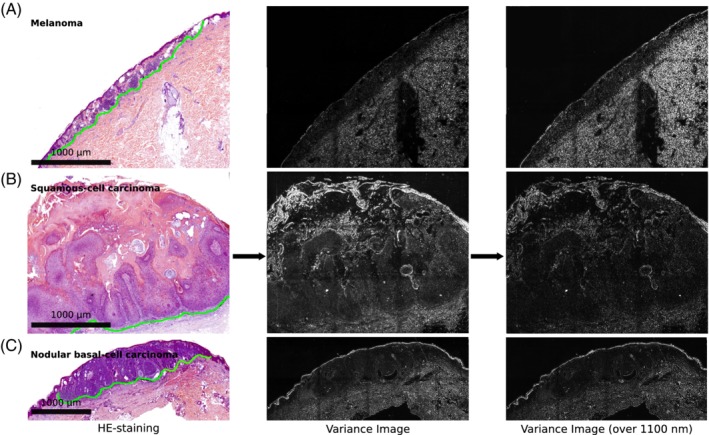
Near infrared (NIR) spectral variance images of different skin diseases. On the left side different HE‐stained skin samples are shown. Of these samples NIR absorption images were collected at different wavelengths. Here, the variance images (along the spectral dimension) for the full spectral range (30 wavelengths) and the >1100 nm range (20 wavelengths) are shown. The green dotted line in the HE staining indicates the border between normal tissue and tumor. A, Melanoma; B, Squamous‐cell carcinoma and C, Nodular basal‐cell carcinoma. The scale bars in the bright field apply also for the corresponding variance images. The tumor area is located above the green line in each sample